State-of-the-Art cases
This FastTrack tool highlights State-of-the-Art cases that showcase how local areas have sped-up their roll-out of sustainable mobility innovations. Toggle through this tool to learn from their experiences, and check back regularly, as more cases will be added soon.
Click on a case to read more details about it. To find specific information, click on the cluster labels at the top of the tool to view only cases that relate to that cluster – click several cluster labels to view cases related to each of them.
The icons running down the left of the tool indicate which cross-cutting theme most closely relates to the case. Click on the icons at the top of the matrix to sort based on cross-cutting theme:
Funding, financing & business models
Digitalisation &
data management
Governance, participation, cooperation, and co-creation
Behaviour change
Sustainable &
Clean Urban LogisticsCycling in the Urban &
Functional Urban AreaIntegrated Multi-modal
Mobility SolutionsTraffic &
Demand Management
Area: urban
Date implemented: since 2017
How long from concept to implementation: 2-3 years
Relation between efforts undertaken and benefits achieved: good
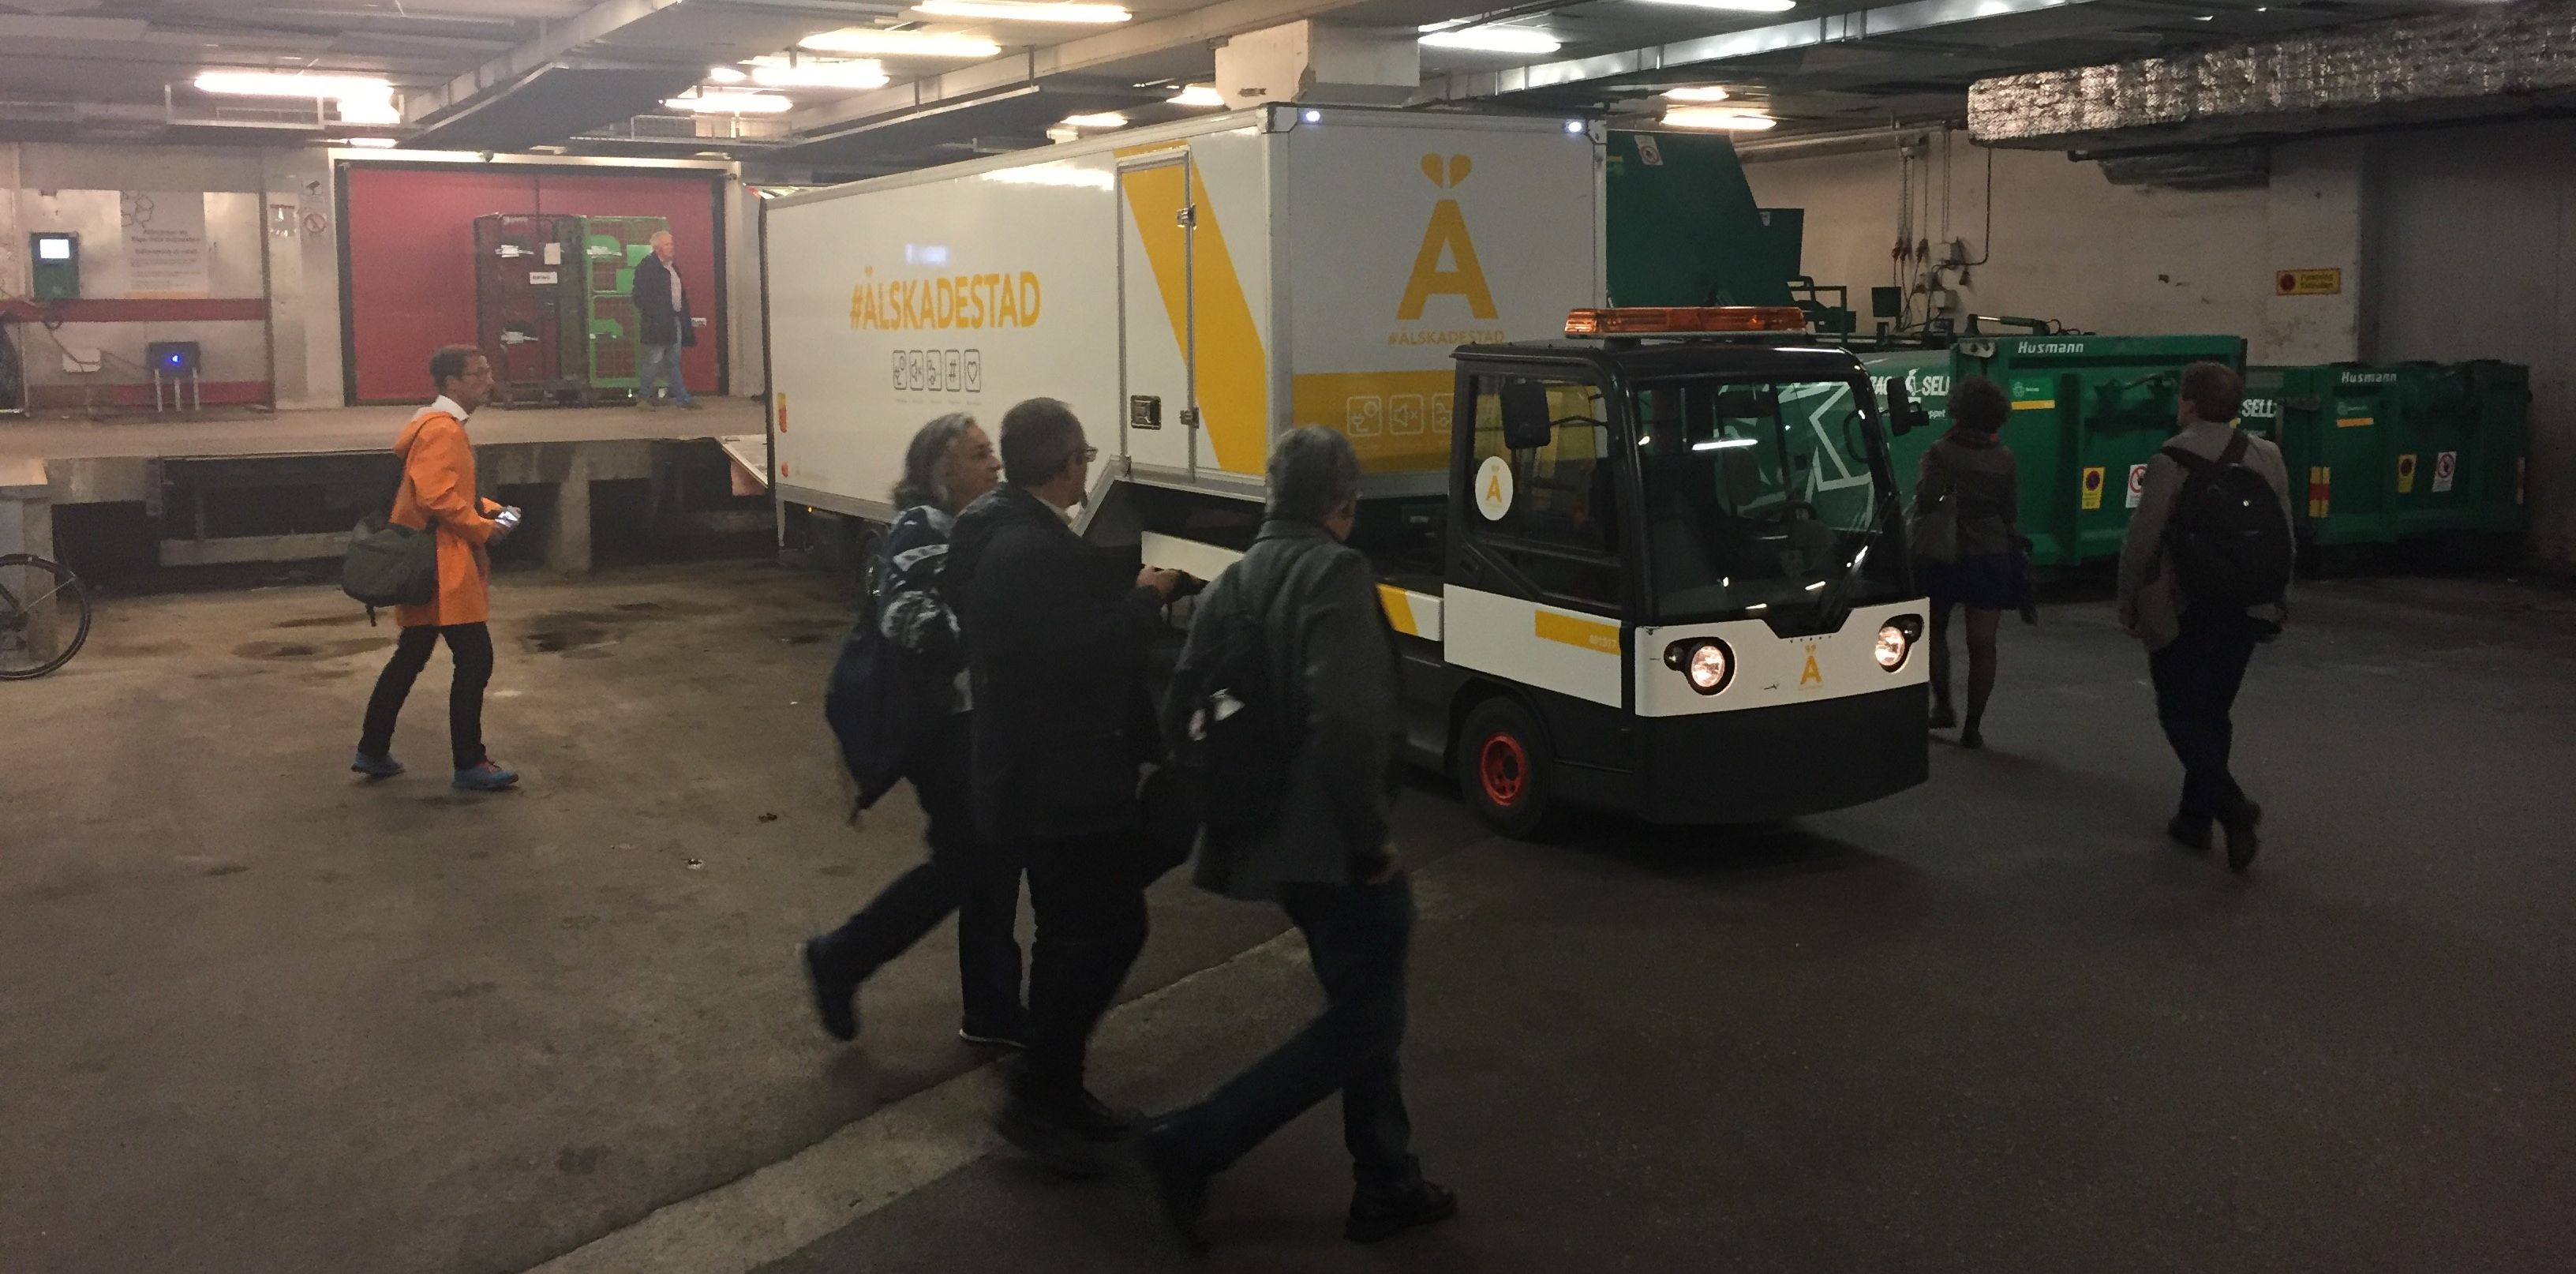
What was done and how: City facilitated cooperation between property owner, parcel delivery firm and material recycling company to enable commercial consolidated inner-city parcel delivery and material collection service.
Why it worked to 'fast track' the innovation/measure: It depends on cooperation between companies in different sectors, reducing possible conflicts; it provides tangible benefits for all involved; it was achieved during a reasonably short time frame and has become business-as-usual.
Lessons learnt: Many! Consolidation in this way reduces traffic volumes, emissions, etc.
Tips for replication: Identify win-win solutions; match property companies with space, to companies willing to test
Sources or links: https://www.alskadestad.se/about-alskade-stad/
Area: urban
Date implemented: since 2019
How long from concept to implementation: less than 1 year
Relation between efforts undertaken and benefits achieved: good
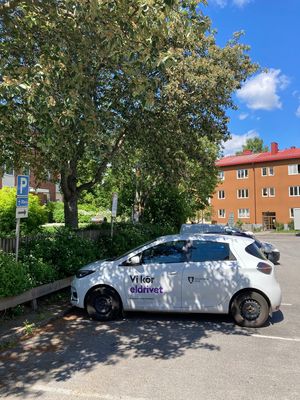
What was done and how: Electric vehicles for city home care services (being implemented within MEISTER). Here the city is introducing EVs and encouraging use of cycles, kickbikes, cargobikes, etc. for home care services where personnel travel around to multiple addresses in the city each day. For many routes, it is easiest without cars; where cars are necessary, we have started using EVs in our own fleet and will introduce related criteria in procurement of private services.
Why it worked to 'fast track' the innovation/measure: Existing infrastructure; relatively easy to switch for these services
Lessons learnt: Works very well even for staff working 3 shifts/day and having little time for charging
Tips for replication: Start with testing vehicles before buying them; start where there is an interest and use these cases as ambassadors to show and spread good examples
Sources or links: https://meisterproject.eu/tag/stockholm/
Area: peri-urban
Date implemented: 2019–2021
How long from concept to implementation: 4-5 years
Relation between efforts undertaken and benefits achieved: good
What was done and how: In the framework of the SMACKER research innovation project, Budapest aimed to develop a Demand Responsive Transport (DRT) system. The Centre for Budapest Transport (BKK) operates seven fully or partially demand-responsive lines. The BKK has launched an online service request system for the DRT service. This system has been available for the public since December 2020 through https://telebusz.bkk.hu/. The new web-based application gives an opportunity to upgrade the obsolete system. After registration, passengers can send their request quickly through their PC or smartphone, so in the future the communication between dispatchers, passengers and the bus drives would be easier. Instead of the time-consuming procedures, the participants of the system could use only the new application. The platform is available in Hungarian and in English.
Why it worked to 'fast track' the innovation/measure: Inadequate and under-used services, excessive costs, lack of last-mile services and proper intermodality, poor communication and information to users and car commuting are the challenges that many central European regions face. This project addressed those disparities to promote public transport and mobility services that are demand-responsive and that connect local and regional systems to main corridors and transport nodes. Soft measures (e.g. behaviour change campaigns) and hard measures (e.g. mobility service pilots) were both used to identify and promote eco-friendly solutions for public transport.
Lessons learnt: importance of involving the communities concerned, continuously encourage the people to use the new tools
Tips for replication: Demand responsive services have several advantages for both the operator and the customers. Keep in mind the importance of the proper communication and the continuous monitoring of the applied vehicle size, headway and timetable based/demand responsive time periods.
Sources or links: https://telebusz.bkk.hu/

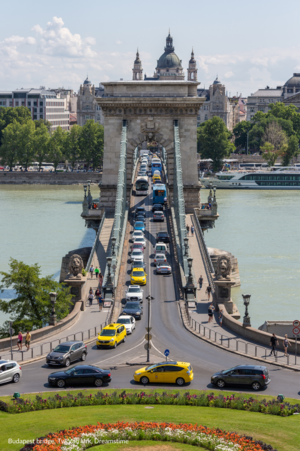
Area: urban
Date implemented: The development of GIS monitoring tool was done from September 2019 to March 2020.
How long from concept to implementation: 4 years
Relation between efforts undertaken and benefits achieved: good
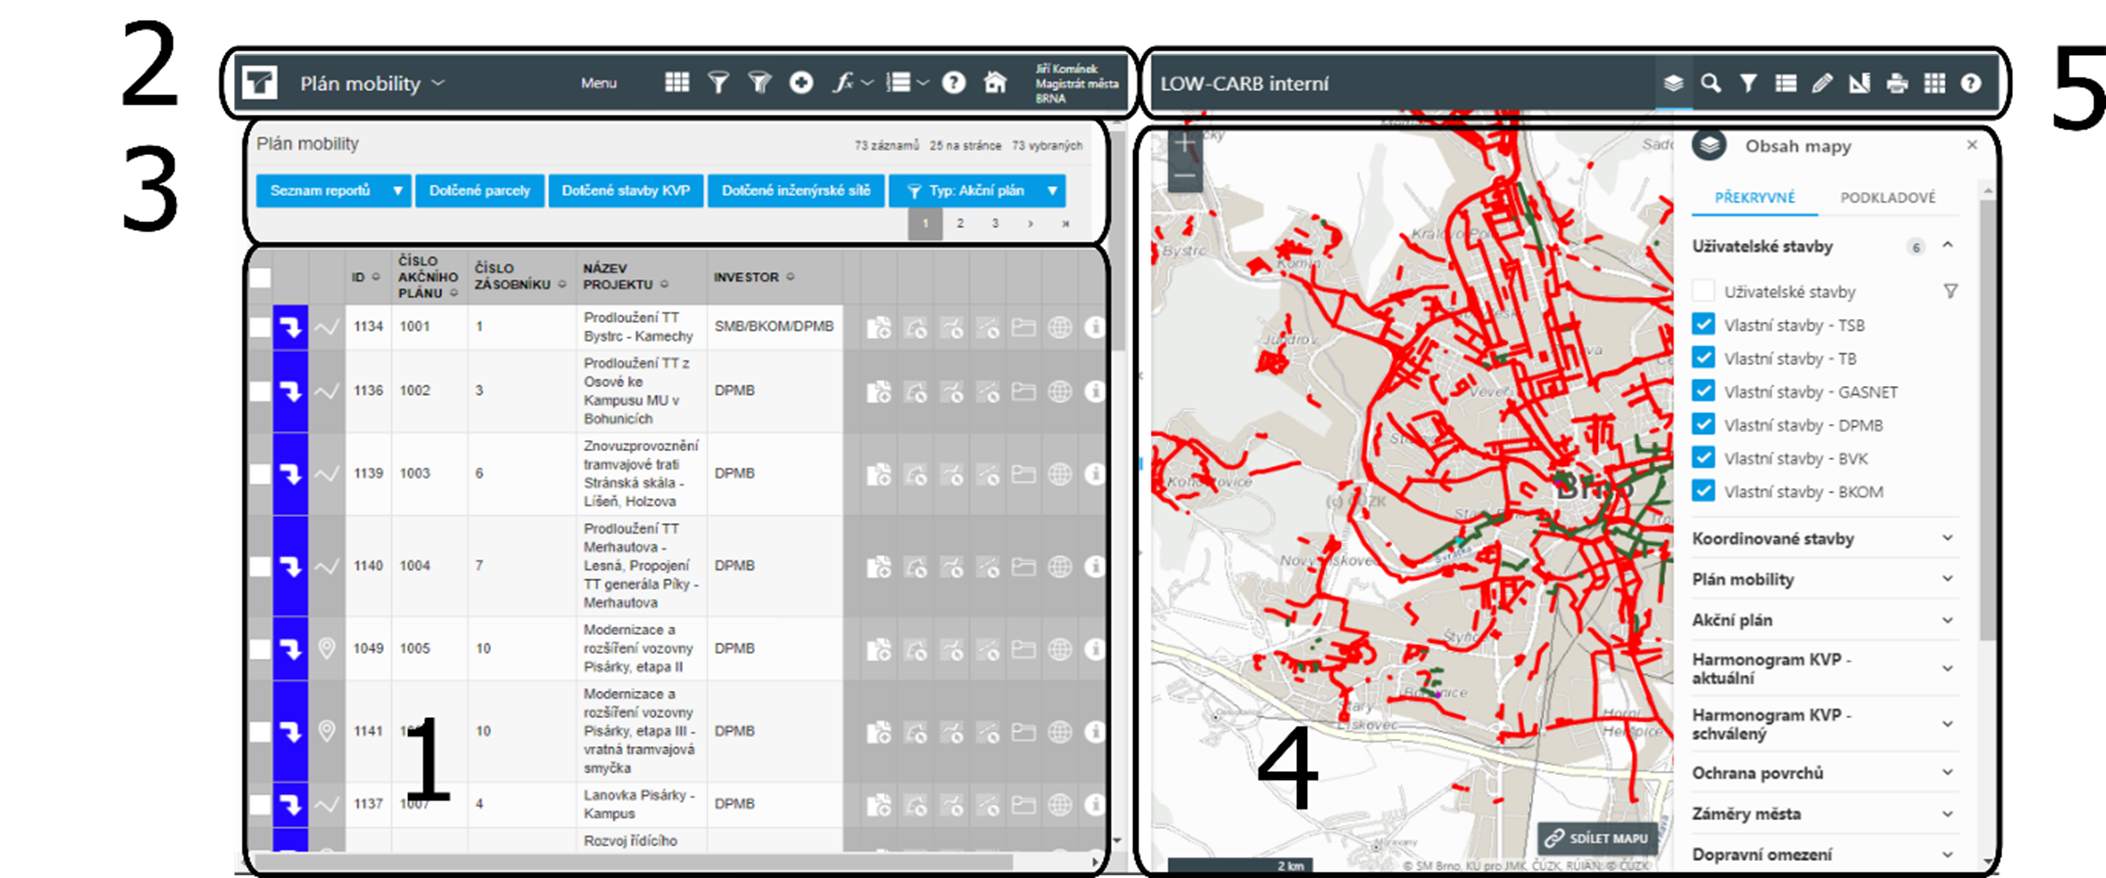
What was done and how: GIS monitoring tool is used within the process of preparing an Action Plan. The tool helps with better monitoring and evaluation of measures. There is also clearer responsibility and, for example, the measure budgets clearly shown. The monitoring is mainly used for work, but a public version is also available to inform citizens. It is easy to change measures and add information, and work on the Action Plan will be easier in the future. The monitoring tool allows cooperation among all stakeholders simultaneously, so there will be significant time saving and better coordination of implementation. It also accommodates citizen participation in the proposal of new measures in the Action Plan.
Why it worked to 'fast track' the innovation/measure: assistance with monitoring and evaluating measures
Lessons learnt: a GIS monitoring tool is not suitable for all measures, e.g. for small measures and urgent measures, such as water or gas accidents. There is a culture of using Excel, and using a new tool was something new for users.
Tips for replication: a SUMP monitoring tool is good for developing and implementing an Action Plan and a package of SUMP measures, because information about measures don’t change often and therefore work on the tool is not too demanding and willingness to put information into tool is higher.
Sources or links: https://gis.brno.cz/mapa/low-carb/?c=-597822.5%3A-1159214.3&z=4&lb=zm-brno-seda&ly=pm-realizace%2Cad%2Culn&lbo=1&lyo=
Area: urban
Date implemented: since Sept 2018
How long from concept to implementation: 10 years
Relation between efforts undertaken and benefits achieved: good
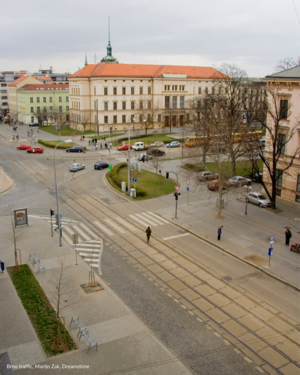
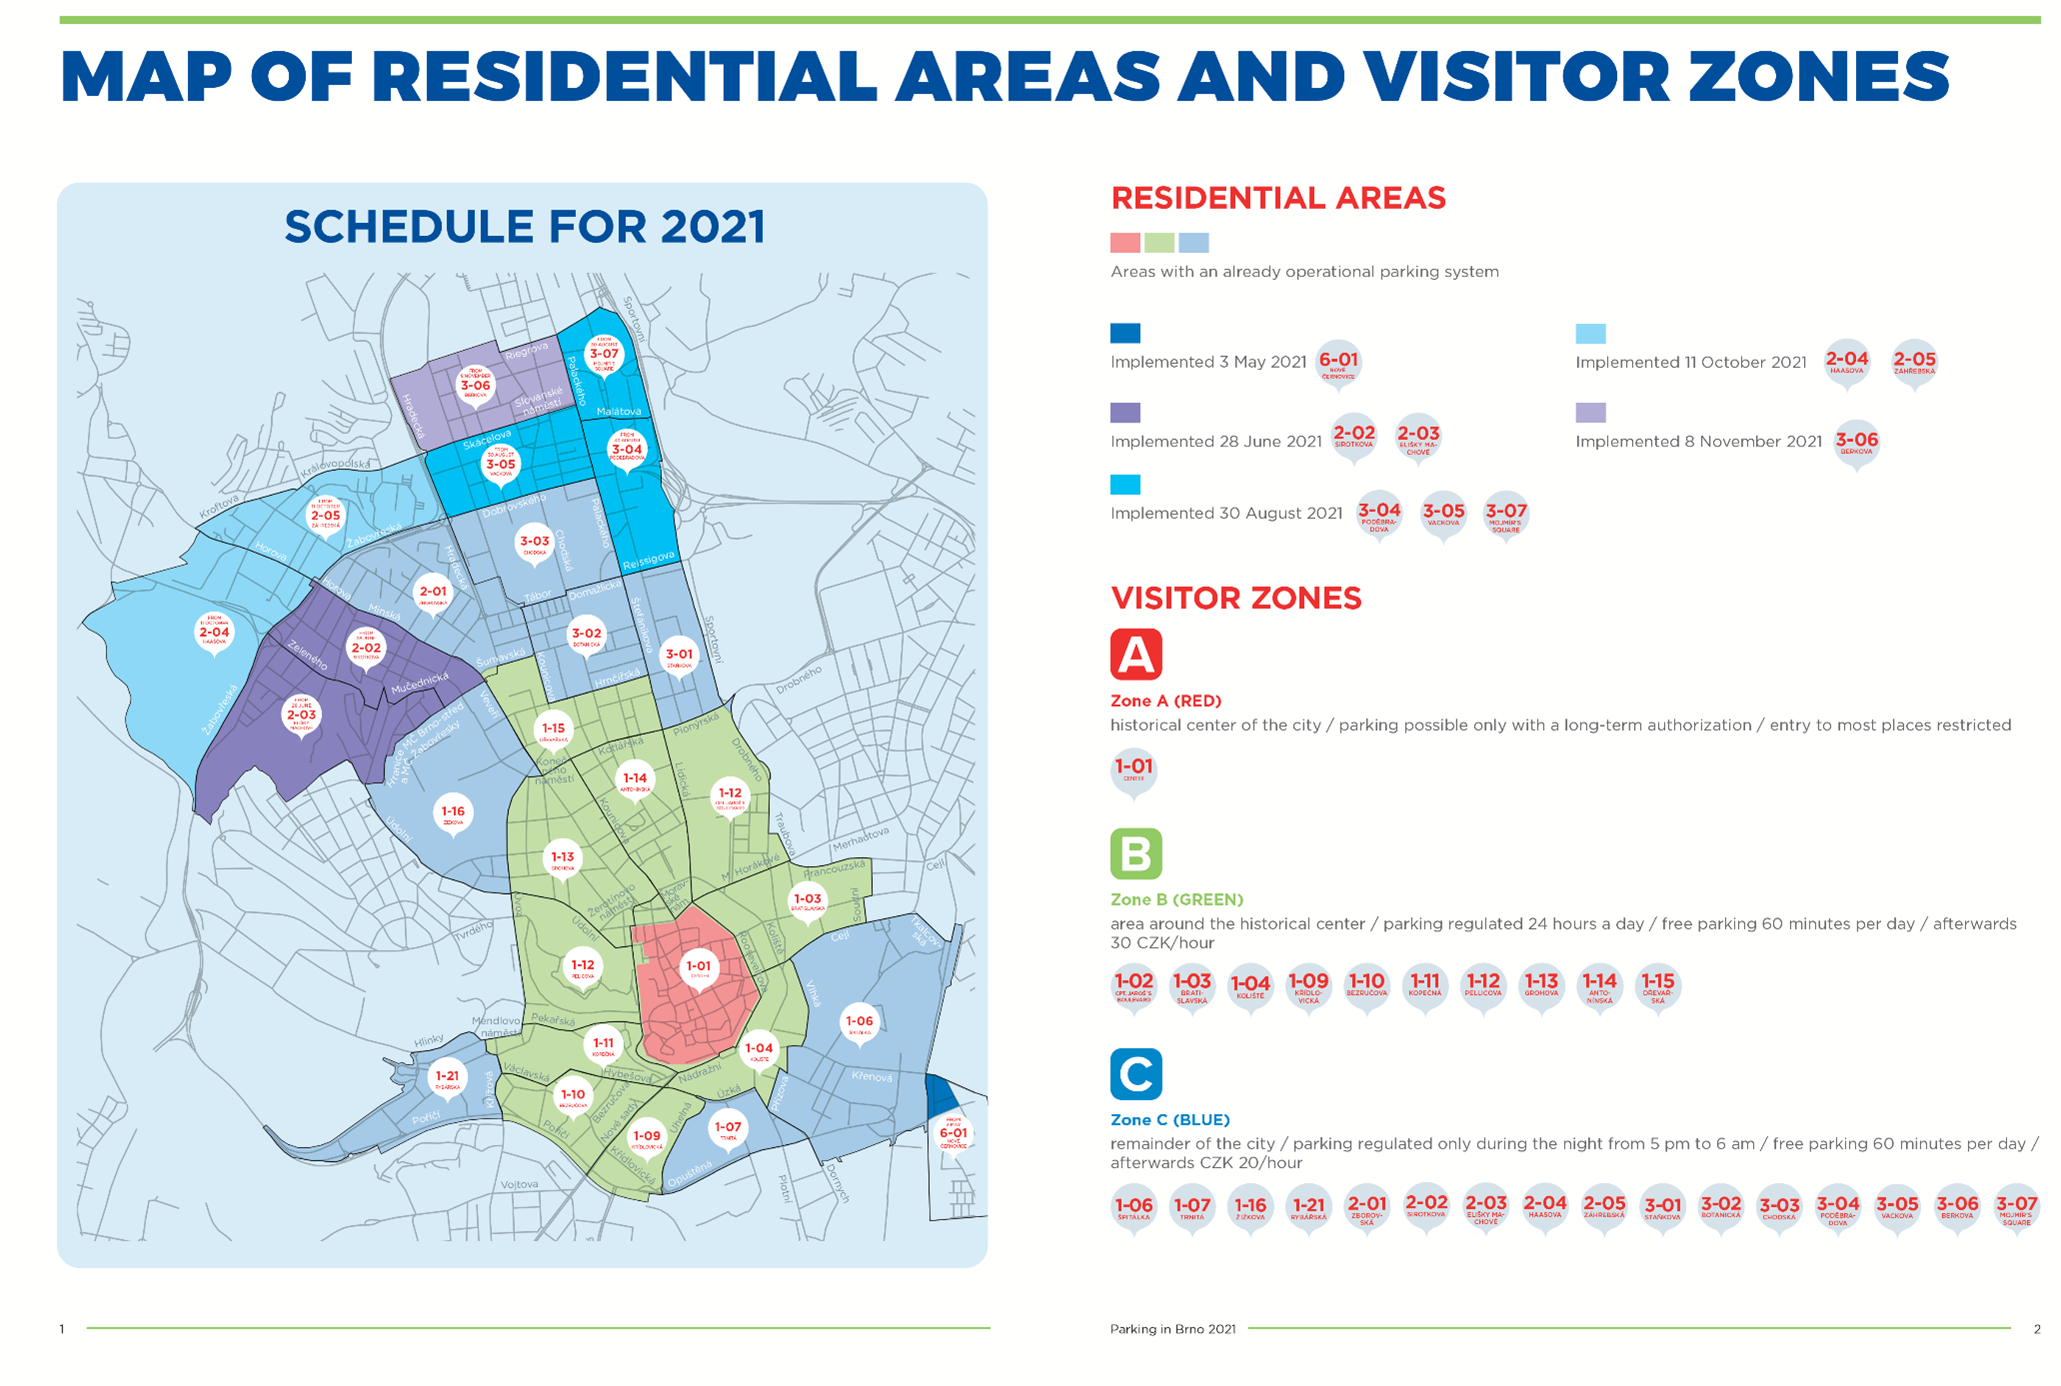
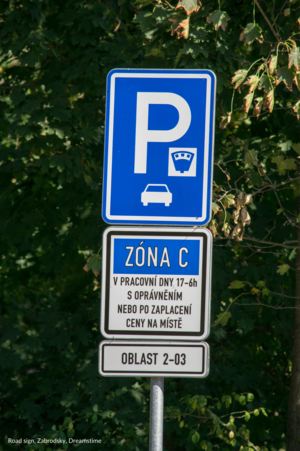
What was done and how: A parking system was established for residents and parking subscribers using the "flower model". A parking permit (for both residents and subscribers) is valid not only in the location of their homes or places of business (the centre of the “flower”), but also in all neighbouring areas (the “petals”). The only exception applies to the most central part of the city where only local residents are allowed to park. For visitors, the system is simply divided in three Visitor zones (A, B and C). In Zone A (historic city centre), no entry is possible for visitors without a permit (except for the Veselá area which is possible to drive through, but with no parking allowed). Zone B is a ring around the historic city centre where free parking is permitted for 60 minutes a day, then for the price of CZK 30 for each additional hour. In Zone C, 60 minutes of free parking a day is possible, then for the price of CZK 20 for each additional hour. To use free parking, one always needs to register with the parking meter or via mobile phone.
Why it worked to 'fast track' the innovation/measure: helps to increase parking turnover, and improves overall parking regulation, lack of parking spaces, and accomodates preferences of residents.
Lessons learnt: after user comments, the system was changed somewhat: traffic signs were changed to be less complicated; payment for parking via SMS became possible; split into three visitor zones
Tips for replication: don't set parking prices too low at the beginning of implementation (residential and visitor), because later it is difficult to change
Sources or links: https://www.parkovanivbrne.cz/en
Area: urban
Date implemented: November 2020
How long from concept to implementation: 2 years
Relation between efforts undertaken and benefits achieved: moderate
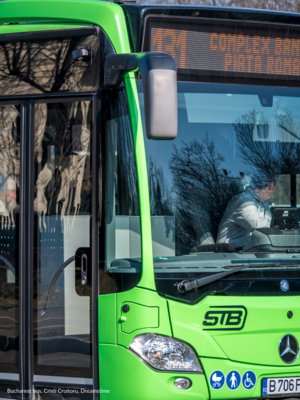
What was done and how: opportunity study, application for funding, procurement, deployment.
Why it worked to 'fast track' the innovation/measure: public transport fleet modernisation and improvement of air quality
Lessons learnt: the simpler the process, the better!
Tips for replication: look for feasible projects and be flexible.
Area: urban
Date implemented: since 2016 (ongoing)
How long from concept to implementation: ongoing process
Relation between efforts undertaken and benefits achieved: good
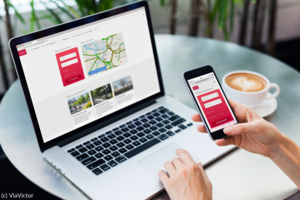
What was done and how: The team of Smart ways to Antwerp works on 5 fields: (1) marketing & communication; (2) marketplace for mobility; (3) stakeholder involvement; (4) tool development; and (5) involvement of employers.
Why it worked to 'fast track' the innovation/measure: dedicated platform and brand; strong communications strategy; strong brand with high brand awareness, raising awareness, and nudging; valuable partner for companies and mobility providers
Lessons learnt: Stakeholder involvement is key, as many different (types of) stakeholders are involved in mobility. Good communication is also key, as soft measures are just as important as hard measures. Creating a positive vibe around mobility is important, focus on the positive.
Tips for replication: The mobility field is constantly changing, so be flexible to respond to new developments. Work on both hard and soft measures. It is not enough to only provide infrastructure and solutions, you also have to underline the benefits and convince people to use them. Have a clear idea of what your target group(s) is/are (e.g. by setting up personas) and your objective(s).
Sources or links:https://www.slimnaarantwerpen.be/en/home
Area: urban
Date implemented: the framework agreement was decided upon by City Council in October 2017, and the Technical Board was commissioned to implement the measures in June 2018. The final decision for plan implementation was adopted in September 2018; all infrastructure measures must be completed by 2031.
How long from concept to implementation: Negotiations from 2014-2017; planning and roll-out since 2018. Investigations/feasibility studies from concept to design and implementation planning has taken an average of 2-2.5 years.
Relation between efforts undertaken and benefits achieved: moderate – impacts of different measures will be apparent at different times; pilots are promising, but the impact of the pandemic remains unknown
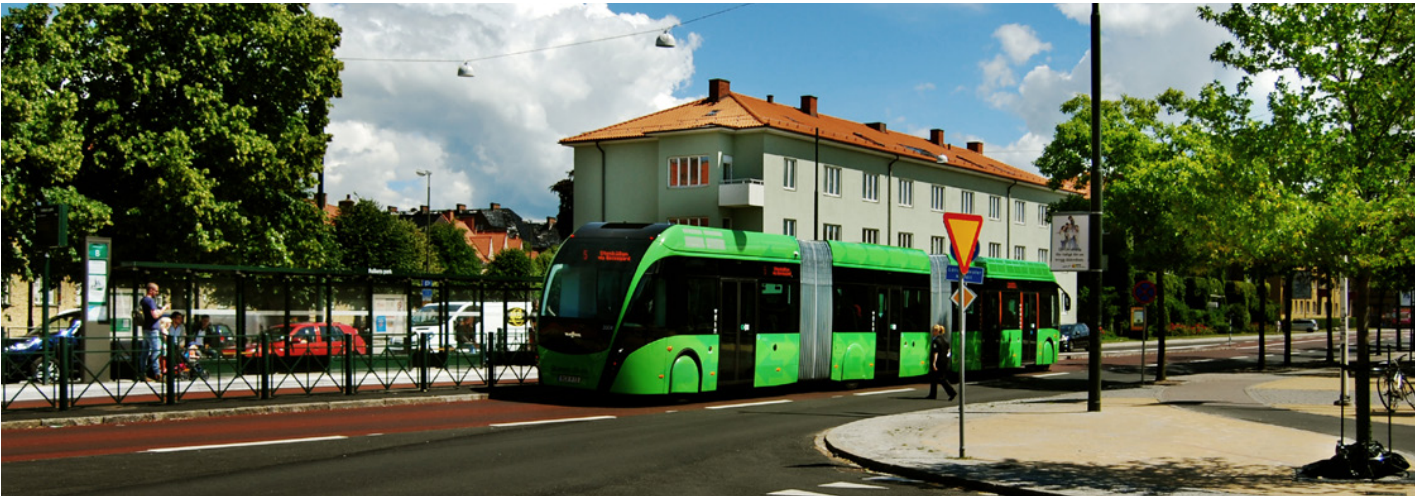
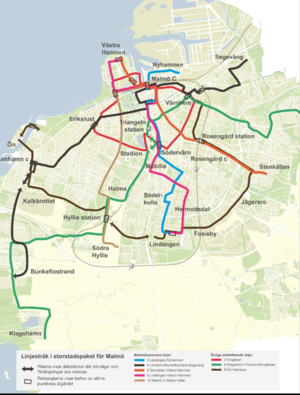
What was done and how: Negotiations took place between national, regional and city level authorities regarding measures that will: (1) increase mobility and accessibility through improved public transport and (2) increase housing production. The project is ongoing, and includes eight bus lines to be electrified, five of which are Malmo Express Busses (MEX); 14 bicycle infrastructure projects and approx. 30 km expansion of cycle paths; development of railway tracks to achieve higher capacity of rail-bound commuter traffic.
Why it worked to 'fast track' the innovation/measure: The three biggest cities in Sweden have an agreement with the government to receive 50% in infrastructure funding (the National Big City Package), given that they deliver both sustainable infrastructure and a considerable amount of housing according to an agreed schedule. Further evaluation is not yet possible, as none of the new bus lines have been put into operation.
Sources or links:https://www.trafikverket.se/for-dig-i-branschen/Planera-och-utreda/finansiering/storstadsavtalen/
Area: urban
Date implemented: ongoing
How long from concept to implementation: still ongoing
Relation between efforts undertaken and benefits achieved: good
What was done and how: Implementing and managing shared mobility, including the city bike sharing system Velo, the upcoming shared (e-)bike system in the transport region, and the private mobility providers ecosystem
Why it worked to 'fast track' the innovation/measure: cooperation with the different stakeholders
Lessons learnt: Good cooperation and interaction with the sector is needed. The government is in a good position to facilitate, bring all players around the table. A regulative framework ensures quality and encourages the development of innovative solutions that are in line with the mobility policy. Data is a challenge.
Tips for replication: Make sure there is a good relationship with the sector. Have your objective clearly in mind so you can decide on the best strategy.
Sources or links:https://www.slimnaarantwerpen.be/en/shared-mobility
Area: urban
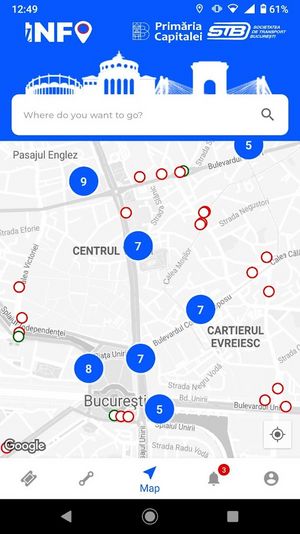
Date implemented: app implemented in 2019; e-payment app in 2020; bike infrastructure finalised in 2020; automated tariff system in 2021
How long from concept to implementation: 1-3 years
Relation between efforts undertaken and benefits achieved: good
What was done and how: The InfoTB app was developed by the public transport operator STB, and then integrated with Metrorex. Payment directly with a card was a common project taken on by STB-Mastercard-TPBI. B-pay was initiated as a pilot project by PT operator STB in collaboration with Mastercard and Unicredit. Bike infrastructure was built within a project initiated by the Bucharest Municipality and funded by the National Environment Funds.
Why it worked to 'fast track' the innovation/measure: All these accomplishments contributed to a better quality of PT services and an increasing number of passengers
Lessons learnt: innovation and digitalisation can contribute to increasing the attractiveness of PT and to improving quality of life by reducing pollution.
Tips for replication: try pilot projects to assess the effectiveness of different measures
Area: urban
Date implemented: 2020
How long from concept to implementation: 1 year
Relation between efforts undertaken and benefits achieved: good
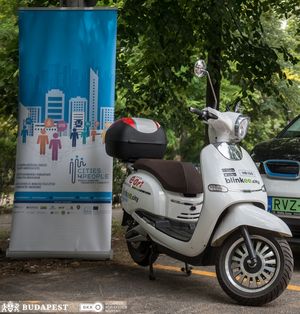
What was done and how: A Mobility Point Network was implemented with 4 locations in the 11th district of Budapest; the network launched on 2 March 2020. The Mobility Point Network ensures that several modes of transport and services can be accessed at a central location for everyone. Locals and tourists alike can choose from bike sharing, electric mopeds, e-scooter sharing, e-car sharing services.
Why it worked to 'fast track' the innovation/measure: The mobility points were co-designed with local communities. The whole planning process had a dynamic nature, the project locations served as real-life urban mobility experiments, where we could evaluate feedback and then re-iterate the process with a revised approach.
Lessons learnt: The project team has gained a reliable understanding of micromobility solutions and Budapest can now further expand and introduce Micromobility Point Network services in several other districts.
Tips for replication: use a bottom-up, collaborative process
Sources or links: https://cities4people.eu/2020/11/03/a-mobility-point-network-in-budapest/

Area: urban
Relation between efforts undertaken and benefits achieved: good – the most critical issue faced was the selection of suitable land for the depot. The realisation itself was much easier as the City of Prague is the owner of the land. The depot itself was bulit very swifly thanks to cooperation with the companies involved.
What was done and how: Freight was collected at the depots outside of rush hour (using cars) and then delivered using only cargo bikes.
Why it worked to 'fast track' the innovation/measure: The result was a reduced number of freight vehicles in the city centre. There are 8 major delivery and logistic companies involved in the pilot project and according to the results the impact was huge. The project became a nominee for the Eurocities Award. The key enabler was support and will from local politics.
Sources or links: https://www.youtube.com/watch?v=ORpByvg9Sag&ab_channel=Eurocities
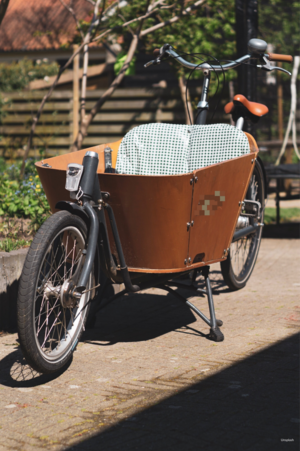
Area: town (40,000 inhabitants) within the Frankfurt Rhein Main Urban Area (2.3 million)
Date implemented: 2017
Relation between efforts undertaken and benefits achieved: The approach applied in Dreieich (and other German municipalities) is characterised by the implementation of relatively simple regulatory and physical measures. First, installation of the "Cycling Street" road sign gives priority to cyclists and sets a speet limit of 30 km/h (by German regulations). Next, the roadsurface width at the "entrance" to each section of the Cycling Street is reduced by arranging vegetation Third, "red carpets" and Cycling Street pictograms are painted on the roadsurface at intersections. No other modfications of the street layout is needed.
What was done and how: A series of "Cycling Streets" connects the centre of Dreieich-Buchschlag with the train station Dreieich-Buchschlag, which is one of the stops along the Frankfurt-Darmstadt route. The measure enables safe and quick commuting by combining cycling with public transport.
Why it worked to 'fast track' the innovation/measure: The relatively quick deployment of this innovative measure is the result of good stakeholder cooperation. It was developed by Dreieich's Cycling Round Table, which brings several local stakeholders together, including representatives from the political parties of the Local Council, the Vice-Mayor, the town's cycling advocate, a local representative of the German Cycling Association (ADFC), and staff from relevant offices of the local administration. After a decision by the Local Council, implementation went smoothly thanks to close cooperation between the different responsible offices, including the heritage protection office that argued against red street marking in an area characterised by historic villas. Residents were engaged during an evening event. Residents' advice was taken under consideration during the planning process. Not reducing the number of parking spots along the Cycling-Streets was one of the conditions stated by local political leaders taking needs expressed by residents into consideration.
Lessons learnt: Relatively simple regulatory and physical measures have the potential to significantly increase safety and comfort for active transport modes. Stakeholder and citizen engagement (here: Round Table, etc.) and give-and-take with locals increase acceptability of innovative solutions.
Tips for replication: It makes sense to integrate Cycling Streets into a regional cycling network. The Cycling Streets in Dreieich will, in the near future, be part of the Frankfurt-Darmstadt "Cycling Highway", which is currently under development.
Sources or links: https://nationaler-radverkehrsplan.de/de/praxis/fahrradstrassen-dreieich

Area: urban
Date implemented: 2018–2019
How long from concept to implementation: 3-4 years
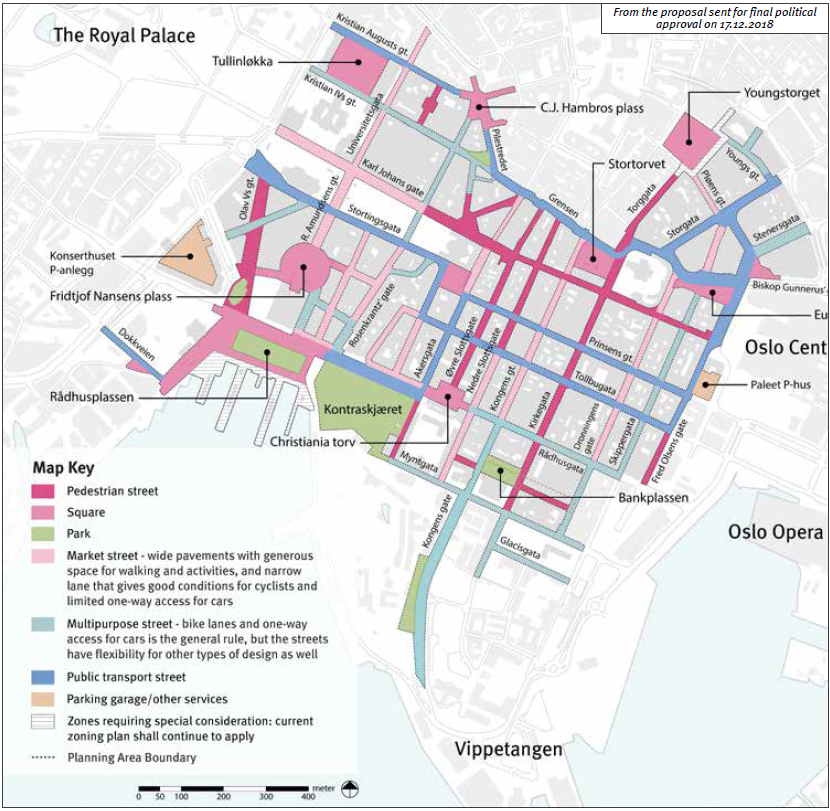
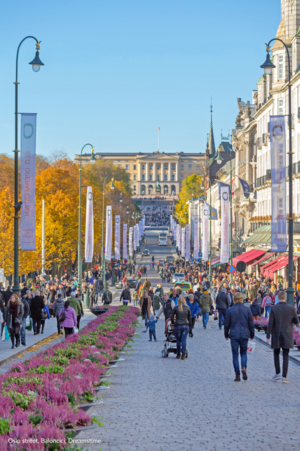
What was done and how: Reduction of private car use in the city centre via: 760 on-street praking spaces reused for alternative purposes (about 9000 spaces remain); closure of streets/plazas to turn over to pedestrians, cyclists, and public life; increased cycle infrastructure; increased public facilities (benches, water fountains, public toilets, green spaces); increased parking for disabled users, freight, and tradespeople
Why it worked to 'fast track' the innovation/measure: local residents gave clear mandate of desiring less car traffic in city centre; council willing to spend significant amount of funding; political will by city council (Greens and Labour)
- https://www.eltis.org/resources/case-studies/oslo-promoting-active-transport-modes
- https://www.oslo.kommune.no/getfile.php/13319592-1553857948/Content/Politics%20and%20administration/City%20development/Car%20free%20city/The%20Car-free%20Livability%20Programme%202019.pdf
- https://projekter.aau.dk/projekter/files/333847997/Master_Thesis_Jacopo_Bassi.pdf
Area: urban
Date implemented: June 2018
How long from concept to implementation: 1 year
Relation between efforts undertaken and benefits achieved: good
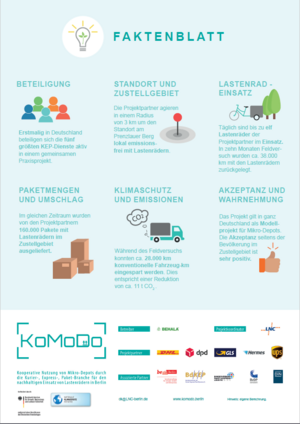
What was done and how: A micro-depot (managed by a neutral company) was cooperatively used by the five biggest German package delivery services (DHL, DPD, GLS, Hermes, UPS) to make the last leg of the delivery via cargobike. Service providers chose to continue using the depot for half a year after the pilot project, and locations for future micro-depots are being actively scouted.
Why it worked to 'fast track' the innovation/measure: The depot was continually optimised during the first year to deliver the infrastructure necessary to allow a cost-effective use of cargo bikes.
Lessons learnt: Locations for micro-depots are dependent on a number of factors, including number of local deliveries, distance between delivery stops, delivery structure of each company, local road network, cost of managing the depot (rent etc). Non-delivered packages needed an additional trip back to the main depot, which led to extra costs. Lower cost of usage and higher drop rate achieved using cargo bikes reduced costs. A mix of cargo bikes and electrical vans would likely be the best sustainable solution, as large packages or a large volume of packages to the same location are not realistic to transport via cargo bike. Micro-hubs increase the economic performance of cargo bike logistics when placed within a short distance of a high number of delivery destinations. Ideally, distances should be up to 3 kilometres. It is important to use the model of an independently managed micro-hub with a high degree of flexibility in terms of organising the trips to accommodate the needs of different courier, express and parcel service providers.
Tips for replication: A main factor for success is locating an efficient place for the micro-depot. Here the city officials can facilitate by actively supporting the search for locations. Use of the micro-depot by several different companies is efficient in terms of time and ressources in regards to finding a location and communicating with local residents. Provide supportive framework conditions for cycle deliveries; make cycle delivery the first choice for municipal deliveries; when tendering for logistics, include cycle delivery as a preferred option. Favour cycle logistics in the procurement procedures of municipalities; address the threat from lorries by limiting access to the inner city.
Sources or links:
Area: urban
Date implemented: March 2017 (pilot); summer 2019 (full project)
How long from concept to implementation: 6 months (pilot); 3 years (full project)
Relation between efforts undertaken and benefits achieved: good
What was done and how: Digitisation among freight companies was improved by offering a smart distribution system app developed by the start-up Inelcan.
Why it worked to 'fast track' the innovation/measure: Intelligent transport system solutions are already widespread and mature, reducing the barriers to using the newly developed specialist service.
Lessons learnt: Stakeholders need to be included early on in the development of the solution to ensure the functionality is tailored to their needs. Furthermore, solutions for urban freight problems should be aligned with the overall urban freight strategy (SULP).
Tips for replication: Include stakeholders early to tailor the offering to their needs and to the city's larger freight strategy.
Sources or links:
- https://civitas.eu/mobility-solutions/d4-service-the-smart-distribution-system
- https://civitas.eu/sites/default/files/measure_evaluation_report_lpa5.1_05042021_final.pdf
Area: urban
Date implemented: September 2019
How long from concept to implementation: 3 years
Relation between efforts undertaken and benefits achieved: good
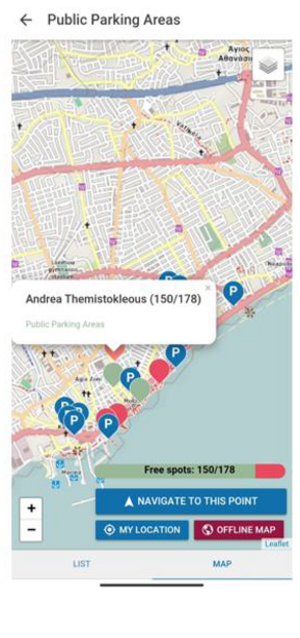
What was done and how: Traffic in the city centre was reduced by displaying parking space information on information boards within the city centre, as well as in a mobile phone application. A significant reduction of redundant trips in the city centre was achieved, as drivers no longer need to circle around to find free parking spaces.
Why it worked to 'fast track' the innovation/measure: Support was received from other agencies, namely the Public Works Department and the Limassol Tourism Board. These also provided additional venues for displaying the parking space data.
Lessons learnt: Parking spaces need to be suitable for installing smart sensors, or the infrastructure needs to be upgraded.
Sources or links:
- https://civitas.eu/mobility-solutions/smart-parking-guidance-system
- https://civitas.eu/sites/default/files/mer_lim_6.4_17052021_final.pdf
Area: urban
Date implemented: August 2018 (pilot); construction of the full project started June 2020
How long from concept to implementation: 1 year (pilot); 3-5 years (full project)
Relation between efforts undertaken and benefits achieved: good
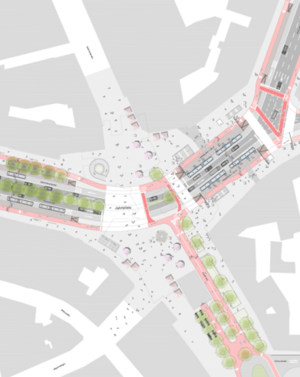
What was done and how: Motorised individual traffic was reduced at a busy urban traffic node and the space was made more attractive for active travel and the public; this also reduced high NO2 concentrations. In the pilot phase, the following physical changes were implemented (costs less than EUR 10,000): bollards put in to separate the pedestrian/cycle street; traffic signs put up to advertise changes; a traffic island implemented to improve cycle connections. These changes were implemented during the summer school holidays to help people adapt while traffic was lower. Overall, transforming the square includes: lanes for general motorised traffic reduced from 2 to 1 in each direction; implementation of a bus lane and expansion/upgrade of cycling lane; transformation of an adjacent street into a pedestrian & cycling street; speed limit reduced from 50 to 30 km/h.
Why it worked to 'fast track' the innovation/measure: The pilot scheme was backed by a study, including simulations, to test the feasability before implementation. A pilot phase was used to help test and push the scheme forward despite its controversial nature. Public consultantions were held on the permanent scheme, which was also the focus of open political discussions, which raised interest. A low cost pilot showed measurable positive effects on emissions and traffic volumes.
Lessons learnt: Major changes to traffic nodes are a controversial choice. Use open dialogue to make people feel heard. Showcase clear motivation for the changes (e.g. excessive emission levels, unattractive urban space).
Tips for replication: Make the planning accessible by including the public; prove viability of measures through pilot schemes; push for evidence-based planning through use of studies and simulations.
Sources or links:
Area: periurban
Date implemented: May 2018 (first launch), December 2019 (final product)
How long from concept to implementation: 1.5 years (first launch), 3 years (final product)
Relation between efforts undertaken and benefits achieved: good
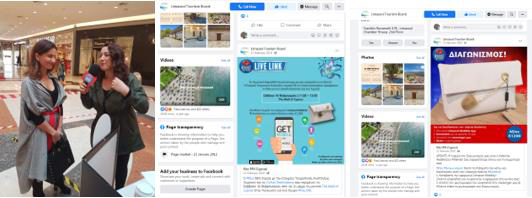
What was done and how: An app (with travel planner function) was developed containing real time information about sustainable transport modes in the Limassol region, as well as information about tourist spots, parking locations, and disabled access.
Why it worked to 'fast track' the innovation/measure: The required data was already available and only needed to be gathered. The application is easy to access and free to use.
Lessons learnt: The required data needs to be collected from different stakeholders, transformed into an uniform format, analysed, and presented. Promotion of services/advertisement can be intergrated as an additional source of funding once the application gains acceptance.
Tips for replication: Engage with relevant stakeholders to gain access to data. Promote application to improve public awareness.
Sources or links:
- https://civitas.eu/mobility-solutions/mobility-application-travel-planner-for-smart-phones-to-provide-real-time
- https://civitas.eu/sites/default/files/mer_lim_7.4_21042021_final.pdf

Area: urban
Date implemented: April 2018 (bike scheme); November 2020 (updated app); February 2021 (data tool)
How long from concept to implementation: 2-5 year
Relation between efforts undertaken and benefits achieved: good
What was done and how: Replacement of the existing bike-sharing scheme with a new one, featuring more bikes (20 e-bikes, 375 smart bikes, 2 disability accessible bikes) and 40 new stations. The sharing scheme is linked with a software platform, which includes a website, custom app, and software at the stations. This can show the available bikes, their locations, and allows to rent a bike. There are also features to encourage sustainable transport, such as information for uses about CO2 avoided per trip and number of trees "planted" by using the scheme instead of a car. The bike scheme forms part of a big data tool that collects information about mobility behaviour and travel patterns. Data sources are the bike scheme, the public bus system, the parking facilities, and anonymised mobile phone tracking data.
Why it worked to 'fast track' the innovation/measure: This was connected to other measures promoting active or sustainable transport, and improving conditions for active travel. The city promoted the scheme via social media and videos. The scheme, specifically the chosen bikes, were tailored to the target location; e-bikes were included in the mix to account for the hilly parts of the city. A custom app was developed for the system, which allowed the city to tailor the services. The city had already previously operated a bike-sharing scheme, so the local circumstances were known and could be fully accounted for. The city innitiated business sponsorship for bike stations, were businesses could advertise on their sponsored station (often near their business or in other strategic locations). A smart contactless card for the public bus system already existed, allowing the integration of the bike share scheme with the same card.
Lessons learnt: It is better to consider the specific needs of more vulnerable target groups – such as elderly
people, physically impaired, etc. – from the beginning of the design stage of the project. It is very important to build up a trust with the system provider. It is crucial to engage key local stakeholders in order to fine tune the bike sharing scheme. The bike sharing scheme should take into account the shape/urban structure of the city. EU-funding is an opportunity to overcome some capital costs. Realistic milestone and goals are important, for example first focusing on the flat areas, then expanding to the hilly areas and wider city.
Tips for replication: Consider the context of the city before launching the scheme. Define realistic goals and target groups. Integrate the scheme into existing services.
Sources or links:
- https://civitas.eu/mobility-solutions/public-e-bike-system-0
- https://civitas.eu/sites/default/files/measure_evaluation_report_lpa4.1_29032021_final.pdf
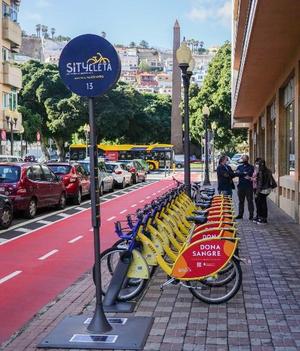
Area: urban
Date implemented: June 2019
How long from concept to implementation: 3 years
Relation between efforts undertaken and benefits achieved: decent
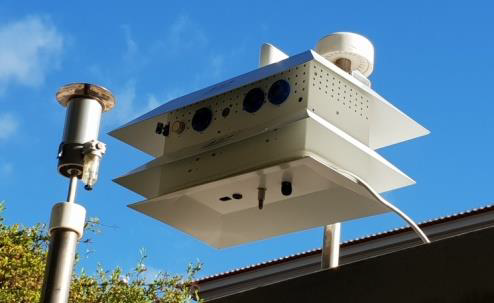
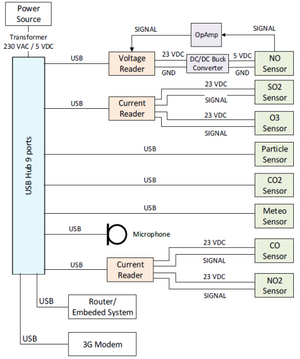
What was done and how: A network of low-cost wireless sensors and webcams was installed to collect information useful in planning the future of the city (traffic, emissions, air quality, meterological data). An online platform was developed to collect the data. Both hardware and software was developed to implement the monitoring network.
Why it worked to 'fast track' the innovation/measure: High involvement of stakeholders; availability of high-level experts
Lessons learnt: The measuring methods need to be verified and validated; this may require using other available datasets (e.g. bus ticketing data) to calibrate sensors. It is challenging to select the ideal system that yields as complete a data set as possible, while maintaining a feasible price. Necessary equipment was not always available on the market, and had to be developed.
Tips for replication: Consider regional/national laws on monitoring. Evaluate how existing data sources can be extended/supplemented with new technology.
Sources or links:
- https://civitas.eu/mobility-solutions/smart-metering-and-user-generated-content-to-improve-planning-and-mobility
- https://civitas.eu/sites/default/files/mer_mad2.2_07062021_final.pdf
Area: periurban
Date implemented: July 2015 (first route open), February 2018 (full implementation)
How long from concept to implementation: 3.5 years (first route open), 6 years (full implementation)
Relation between efforts undertaken and benefits achieved: good
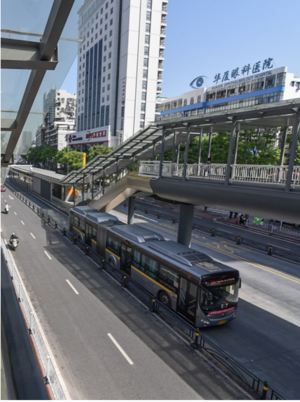
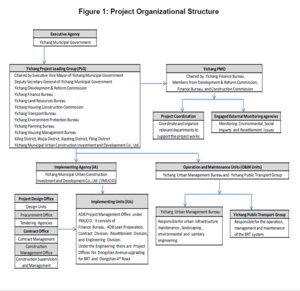
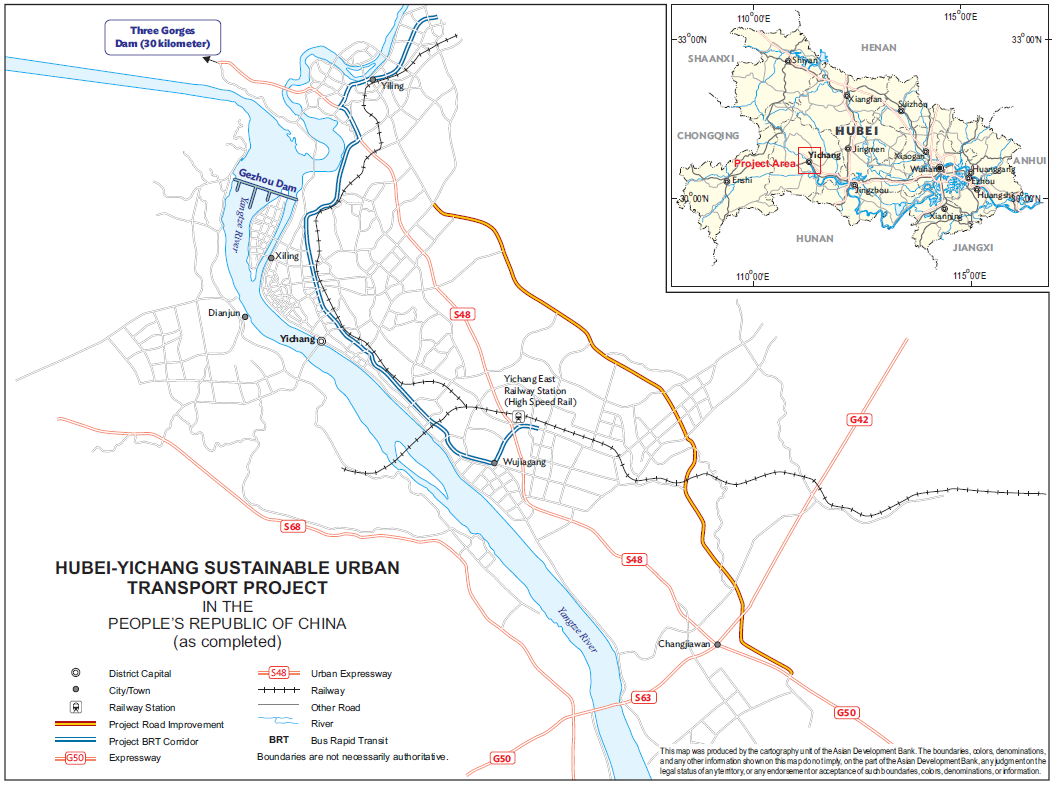
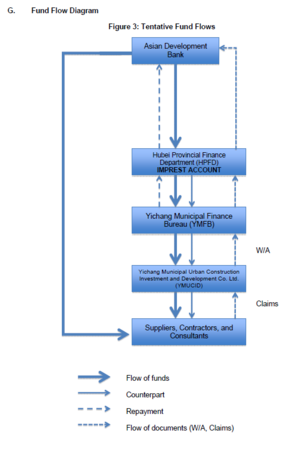
What was done and how: A 23.9 km bus rapid transit (BRT) system was built in the median of the main arterial road in Yichang. Services operate from the provincial bus terminal in Yiling District and end at Yichang East railway station. The route connects the main residential and business districts to the city’s new logistics and industrial park and to the high speed railway station. The BRT includes dedicated, centre-running bus lanes, fully enclosed bus stations, a bus management system and bus information system, a fare collection system, and parking management along the BRT corridor. Funding was procured from municipal funds, a domestic state-owned bank (China Development Bank/Industrial and Commercial Bank of China), and a multilateral development bank (Asian Development Bank).
Why it worked to 'fast track' the innovation/measure: Top city leadership was directly involved in the implementation of the project and fully supported it. City leadership ensured that interagency coordination went smoothly. A special institutional setup was used to manage the project. A leading group, with its own headquarters and a Deputy Mayor in charge, was responsible for managing all other players in the project and liaising with funding providers to ensure implementation was in line with requirements.
Lessons learnt: A comprehensive study prior to planning enabled swift action to address the needs of the city, informed the project designs, and helped convince shareholders through evidence-led planning. Strategic, low cost options along major arteries can bring more value than extensive road building to accomodate personal transport options. It is possible to design for social inclusiveness by connecting areas underserved by public transport and sustainable modes to the transport network. Actively engage with citizens and other stakeholders to avoid feelings of alienation common in large-scale projects. Learn from similar existing projects, as well as experts in the field, to increase the efficiency and value of the project. Holistic interventions adressing several issues increase the impact of each single measure.
Tips for replication: Engage in policy dialogue with potential funders: Yichang changed the proposal from one focused on road building within the city to one based on a BRT system following dialogue with the Asian Development Bank. Focus on a wholistic approach using several interlocking measures to tackle an issue.
Sources or links:
- https://development.asia/case-study/optimizing-road-use-congested-city
- https://www.adb.org/projects/45023-002/main
- https://www.itdp.org/city-transformations/yichang/
- https://www.eltis.org/discover/case-studies/yichangs-holistic-award-winning-approach-sustainable-transport-china
Area: urban
Date implemented: January 2017
How long from concept to implementation: 5 years
Relation between efforts undertaken and benefits achieved: good
What was done and how: Pedestrian and bicycle facilities (bicycle lanes and parking areas) were implemented along the bus rapid transit (BRT) corridor and at key intersections, supporting accessibility and safety of bus passengers and other non-motorised transport users. Car parking spaces (legal & illegal) were reclaimed to improve conditions for walking and cycling along the BRT line. This included new separated cycling paths, as well as the installation of street furniture that discourages illegal car parking. Bicycle parking stations and a bike sharing system were implemented along the BRT corridor and in the city. Funding was procured from municipal funds, a domestic state-owned bank (China Development Bank/Industrial and Commercial Bank of China), and a multilateral development bank (Asian Development Bank).
Why it worked to 'fast track' the innovation/measure: Top city leadership was directly involved in the implementation of the project and fully supported it. City leadership ensured that inter-agency coordination went smoothly. A special institutional setup was used to manage the project: a leading group, with its own headquarters and a Deputy Mayor in charge, was responsible for managing all other players in the project and liaising with funders to ensure implementation was in line with requirements.
Lessons learnt: A comprehensive study prior to planning enabled swift action to address the needs of the city, informed the project design, and helped convince shareholders through evidence-led planning. Strategic, low-cost options along major arteries can bring more value than extensive road building to accomodate personal transport options. It is possible to design for social inclusiveness by connecting areas underserved by public transport and sustainable modes to the transport network. Holistic interventions adressing several issues increase the impact of each single measure.
Tips for replication: Engage in Policy dialogue with potential funders.:Yichang changed the proposal from one focused on road building within the city to one based ona BRT system and bypass after dialogue with the Asian Development Band. Focus on a wholistic approach using several interlocked measures to tackle the issue. Comission exhaustive geological and ground surveys before construction to avoid delays during construction.
Sources or links:
Area: urban and suburban
Date implemented: 2021
How long from concept to implementation: gradual and a bit unclear; current tests were planned in 2020-2021 and started in mid-2021
Relation between efforts undertaken and benefits achieved: good
What was done and how: Last-mile delivery and collection of parcels. Test with different service providers – Iboxen (an actor-neutral service open to all delivery firms) have a trial with delivery boxes on public streets in the inner city; and off-street on land owned by city property companies in suburbs; additional tests with PostNord using a proprietary system enables comparison of different approaches and identification of suitable measures in future.
Why it worked to 'fast track' the innovation/measure: The inner city tests are a collaboration between the City Traffic Office and the companies involved; these involve granting special temporary permits conditional on certain performance criteria, so that the trials can be evaluated, and a more permanent approach developed. The suburban tests are a collaboration between three (soon four) city-owned property companies and the private operators – these are "quicker" to implement as the tests take place off-street, meaning fewer administrative hurdles need to be overcome.
Lessons learnt: For the inner city, some of the lessons learnt were regarding permit rules, aesthetics, open-access requirements and systems, placement strategy, and the use of environmentally-friendly vehicles. For the suburban tests, similar challenges were found but with a stronger emphasis on residential users (as in the inner city, users may not necessarily live close to boxes, whereas in the suburban trials they are likely to live closer).
Sources or links:
- The actor-neutral service is called Iboxen https://www.iboxen.se/

Area: periurban
Date implemented: January 2017
How long from concept to implementation: 5 years
Relation between efforts undertaken and benefits achieved: good
What was done and how: A bypass road was built to redirect freight traffic away from the city centre and ease congestion. Yichang has a high volume of freight traffic from riverway shipping either bypassing the local dam's ship-lock capacity or moving on to destinations away from the river. This improves the capacity for waterway shipping, considered to be a mode sustainable logistics mode. More specifically, a 23.4 km extension of Dongshan 4th Road was built to accommodate through traffic and freight traffic, including pass-dam trans-shipment. The project comprises: (i) improvement of 12.3 km of the Fazhan Avenue–Bailinhe Road section to become a road width of 44-70 m; and (ii) improvement of the 11.1 km Bailinhe Road to Xianfeng Road section to become a Class 1 highway, with a road width of 24.5 m. Overall, this work includes 11 bridges and two tunnels. Funding was procured from municipal funds, a domestic state-owned bank (China Development Bank/Industrial and Commercial Bank of China), and a multilateral development bank (Asian Development Bank).
Why it worked to 'fast track' the innovation/measure: Top city leadership was directly involved in the implementation of the project and fully supported it. City leadership ensured that inter-agency coordination went smoothly. A special institutional setup was used to manage the project: a leading group, with its own headquarters and a Deputy Mayor in charge, was responsible for managing all other players in the project and liaising with funders to ensure implementation was in line with requirements.
Lessons learnt: A comprehensive study prior to planning enabled swift action to address the needs of the city, informed the project design, and helped convince shareholders through evidence-led planning. Strategic low-cost options along major arteries can bring more value than extensive road building to accomodate personal transport options. Holistic interventions adressing several issues increase the impact of each single measure.
Tips for replication: Engage in policy dialogue with potential funders: Yichang changed the proposal from one focused on road building within the city to one based on a BRT system and bypass after dialogue with the Asian Development Bank. Focus on a wholistic approach using several interlocked measures to tackle the issue. Comission exhaustive geological and ground surveys before construction to avoid delays during construction.
Sources or links:
- https://development.asia/case-study/optimizing-road-use-congested-city
- https://www.adb.org/projects/45023-002/main
- https://www.itdp.org/city-transformations/yichang/
- https://www.eltis.org/discover/case-studies/yichangs-holistic-award-winning-approach-sustainable-transport-china
Area: urban
Date implemented: June 2020
How long from concept to implementation: 3 months (pilot)
Relation between efforts undertaken and benefits achieved: good
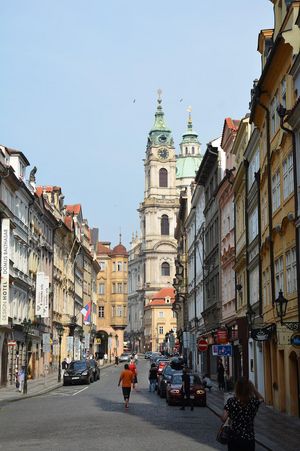
What was done and how: Prague set out to install micro-depots in the city centre to contribute to streamlining logistics delivery, so that goods always arrive from the shortest possible distance. The idea of the city’s bicycle depot was conceived of as a response to a rapidly growing volume of deliveries by transport companies during the COVID-19 lockdown, paired with the city administration’s interest in freeing up public space, especially in the city centre. The City Council decided to implement this as a pilot, which ran for 6 months with regular evaluations. In spring 2021, an expansion of the services with a Logistics Hub, equipped with automatic parcel lockers and pick-up points, was planned. Currently, over 10 different types of cargo e-bikes can be seen in operation, including Larry vs Harry Bullitt, Velove Armadillo, Hinterher bike trailers, and Rytle cargo delivery systems. The entire space is nicely protected under a bridge against direct weather in a central area within Prague. The depot offers heated facilities for couriers, including a kitchenette and showers, a universal charging station for e-bikes and a service station.
The measure lowered the number of cargo vehicles in the city centre, as the shipments were collated in the depot outside of rush hours, and then delivered only by cargo bikes. The couriers have delivered over 50,000 parcels and covered more than 23,000 kilometres, demonstrating tangible success of the depot. Thus another important milestone was that the City of Prague decided to expand the pilot project with the second location, Anděl, which will allow companies to focus on Prague and its surroundings.
Why it worked to 'fast track' the innovation/measure: The cargo depot was the first location of this kind in Prague, offering a central space from which eight major delivery and logistics companies could move parcels from vans to cargo-bikes. Accelerating factors included: political support (the area selected was already owned by the city administration, which allowed for the rapid building and set-up of the depot), and good cooperation and coordination between the public and the private actors, which was key to rapidly making decisions and implementing the measure.
Lessons learnt: The key enabler for the cargo depot was the clear support and willingness from local politicians to find a quick and sustainable solution to the rising number of parcel deliveries.
Tips for replication: The most critical and important milestone of the project was the selection of the suitable land for the depot. Once the right spot had been selected, the implementation itself was much easier, as the City of Prague was the owner of the land. The depot was then built swiftly thanks to cooperation between the companies involved.
Sources or links:
- The project was nominated for a Eurocities Award, which rewards innvoative measures: https://www.youtube.com/watch?v=ORpByvg9Sag&ab_channel=Eurocities
For more details, contact Jaroslav Mach, Head of Department for Transport Development: jaroslav.mach@praha.eu
Area: across the region including, but not limited to an urban centre
Date implemented: 2005 (first equipment and datasets); 2021 (infrastructure and partner engagement)
How long from concept to implementation: The Living Lab is dynamic and continuously evolving. The first equipment and datasets for the project were acquired in 2005, whereas the laboratory’s infrastructure and activities related to real time data and services to be provided to the city were clearly determined in 2012. This is when the first potential partners were contacted to create strong engagement relations for the future.
What was done and how: The Thessaloniki Smart Mobility Living Lab is a user-driven innovation environment where users and producers co-create innovation in a trusted, open ecosystem. Using innovative methods, public and private institutions participate in data collection and take part in the co-design of provided services. Users also have the ability to assess services for their continuous improvement. The use of data shared by users’ social media ensures a strong link between design and real-life user behaviour, and further strengthens collaboration between policy makers and users.
The Living Lab collects transport-related data related through both an external network of sensors (Bluetooth, cooperative units), as well as its ecosystem of partners, including CERTH/HIT and various public and private stakeholders. The whole ecosystem benefits from the exchange of knowledge. It is a one-stop source for mobility data and services in Greece, where both mature and new technologies are used side-by-side to efficiently handle data streams.
Thessaloniki Smart Mobility Living Lab collects, filters, processes and analyses data related to the mobility of persons and goods. It also ensures and validates data quality and provides value-added services to raw data, combining multiple sources and contents in a modular and scalable way. This means that it has the ability to easily integrate new data sources and procedures and at the same time efficiently manage the big volume of data. Thus, it addresses mobility data collection and validation; traffic pattern definition; mobility governance and orchestration; and understanding mobility needs and traffic in cities.
These activities have enabled to development of services and applications for end users, such as: traffic status and travel estimation; traffic and fleet management; multi-modal routing/navigation; and digital twin development.
The benefits achieved so far in the project relate to the Lab’s research goals, and rely on: transport content aggregation; data management and observatory; hosting internal and third-party services; a platform for service development; provision of research infrastructure, datasets and software; support to researchers and academics; and provision of services to the public, organisations and administrations.
Through the processing of data, THESSM@LL has the ability to implement test bed platforms for new technologies, innovative transportation models and algorithms, and prototype for applications arising from research, which still focusing on citizen engagement and participation.
Although numerous benefits have been achieved, there remains a need to align the laboratory’s projects with its strategy. These projects should not only be efficiently executed but also the scalability and the sustainability of their results should be ensured.
Why it worked to 'fast track' the innovation/measure: The accelerated deployment of THESSM@LL was achieved through participation in nationally- and internationally-funded projects, the development of added-value services for third parties, and long-term collaboration with the ecosystem and end-users. Some examples of the projects and partnerships referred to are:
- HIT supports the FOTNETDATA project (http://fot-net.eu/) through the COMPASS4D and COGISTICS projects with its participation in various workshops presenting the collection and the use of project data.
- Thessaloniki is one of the three European cities that have created a pilot application on the TM2.0 platform (http://tm20.org/)
- Thessaloniki was selected as a transport pilot by Big Data Europe project (BDE - http://www.bigdata-europe.eu/), which aims to empower European communities with multi-domain DataTechnologies. Apart from the access to the project’s data, the THESSM@LL has technological and consulting support and is recognized as a “key lighthouse project in the Europe and big data strategy which assumes a leading role in big data technology within its community”.
- CERTH/HIT’s proposal “Open Data Centre” has been selected by the Greek Research and Technology Network (GRNET) and thus, the THESSM@LL benefits from the GRNET’s infrastructure including technological tools, technical support, cooperation with other research groups and internationalisation.
- CERTH/HIT had representatives twice in Research Data Alliance (RDA) Plenary Meetings in Paris in 2015 and in Tokyo in 2016. Dr Josep Maria Salanova Grau and Manos Chaniotakis attended the 6th and 7th meetings respectively focused on data. The active participation of HIT in the RDA organisation is among the Institute’s future goals.
- CERTH/HIT is a co-founder of Thessaloniki Technology Park Management & Development Corporation S.A (TTP). Among the future initiatives of the Thessaloniki Technology Park is the development of the THESS International Technology Center (ThessINTEC). ThessINTEC is a new 4th generation, sustainable and international center in Thessaloniki focused on partnerships between research and industrial actors of the region and the world.
- THESSM@LL join the European Network of Living Labs and the EIT Urban Mobility as a core member. Also, CERTH/HIT supports the interconnection of local ecosystem with the initiative of EIT Urban Mobility by organizing training seminars and workshops, B2B events, and participating in local, regional and national dissemination and communication fairs.
Lessons learnt: Barriers include: lack of funding; reluctance among some stakeholders to share data; and citizen engagement. Enablers of success include:
- Vision and strategy: the THESSM@LL has a long-term strategy for ensuring its sustainability through its own resources in terms of infrastructure and staff, and additionally through its participation in funded projects
- Infrastructure: The lab contains mature infrastructure that is being constantly used for its purposes. It includes internal equipment such as computer clusters, servers etc. along with external such as devices to transmit data (Bluetooth detectors)
- People: The lab has a core group that brings diverse and interdisciplinary expertise, knowledge and experience. This team of people can therefore expand the capabilities of the lab above and beyond the transportation sector
- Network: The lab and the institute has established a network of stakeholders that provide data and receive services and applications. Furthermore, the stakeholders expand and validate the lab’s knowledge on current market and research conditions
Sources or links:

Area: urban
Date implemented: 2020
How long from concept to implementation: 1 year
Relation between efforts undertaken and benefits achieved: Benefits very positive compared to efforts.
What was done and how: The practice aims to improve road traffic and citizens’ safety by implementing an adaptive management system of urban traffic and video surveillance. Implementation resulted in: reduction of traffic congestion and travel time to 8.48 mins/journey in September 2020, compared to 20 mins/journey in November 2016; an increase in average traffic speed to 35.37 km/h in September 2020, compared to 15.75 km/h in November 2016; a decrease in the number of road accidents to 1,630 in September 2020, compared to 8,750 in November 2016; and a decrease in the number of road crimes in the monitored area to 120 in September 2020, compared to 3,770 in November 2016.
Why it worked to 'fast track' the innovation/measure: This measure was successful and implemented rapidly due to its innovative nature, including planning and implementation of a modern, intelligent traffic management system. Technology was put in place that can manage the highly complex traffic systems, and which features software modules for the communication system and fiber optics, the Public Transport Management system, the information system, the intersection traffic control system (latest generation of traffic controllers, LED traffic lights, acoustic devices, pedestrian buttons), the LED Variable Message Signs, the automatic license plate recognition system, the fault management system, the video surveillance CCTV, and various detection systems.
Lessons learnt: The Municipality of Timisoara states barriers referring to the results of the tender that were contested and the procedure was annulled and resumed after several months, the contract for the implementation of the project that was signed after 23 months and the delays in the implementation phase that caused some costs to become non-eligible. SWARCO, who undertook the implementation of this innovative solution, also stated barriers in terms of time and budget constraints.
Sources or links:

Area: urban
Relation between efforts undertaken and benefits achieved: good
What was done and how: In sum: the public transportation system in Madrid became so complex that a sophisticated and innovative monitoring system had to be (and was) put in place.
Over the past few year, EMT (the public transport company owned and managed by Madrid City Council) has changed from central host-based system, SNA networks and Novell, to using a distributed process system, TCP/IP communications, web servers, etc. Because of the growing number of machines and users, their main goal is to have reliable control over hardware status, process and systems. Control systems must also be adaptable, to accomodate growth and diversity. Throughout its headquarters and six operation centers, there are over 100 servers in total, 70 WiFi access points, switches, etc. In addition to these machines, there are more than 500 internal users and a few hundred-thousand customers who use the service availability system through client applications. Because high service availability is mandatory, both for internal and for end-user systems, a monitoring system had become paramount.
The implementation of this innovation resulted in:
- a unified and universal interface to manage information
- monitoring unified in one tool
- information in real time by e-mail or SMS
- performance inventory obtaining status information
- set different access profiles, allowing all users to benefit from the information they need
- cost savings
Why it worked to 'fast track' the innovation/measure: A system like the adopted Pandora FMS allowed the monitoring of multiple parameters, in real time, through one web console. Furthermore, it permitted the system to be left unattended by setting the agent into watchdog mode, a task that, prior to Pandora FMS, would have been executed by the system administrators, involving scheduled revisions of the system, and a hurried response following a problem detection.
Sources or links:
Area: urban
Date implemented: 2004
How long from concept to implementation: Measures (and others like them) were easy and fast to implement. No construction works were necessary, only the programme of the traffic lights has to be changed. This is comparatively cheap and can be implemented without great effort.
Relation between efforts undertaken and benefits achieved: very good
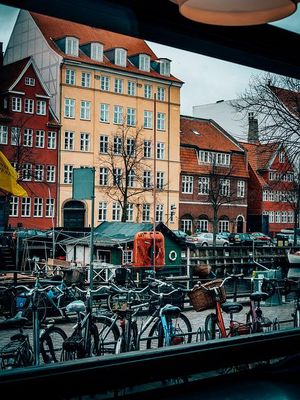
What was done and how: Copenhagen is famous for its bicycle-friendly highways, with broad two-lane cycleways clearly separated from the road. However, cycling was still a stop-start process, with traffic lights favouring cars and buses, and bicycles unable to maintain an even speed. In order to cut the use of fossil fuels and ease mobility, and help the city meet its goal of becoming the world's first carbon-neutral capital by 2025, there was still more to be done to support cyclists, in particular to make their journeys quicker and safer.
Before 2004, traffic lights were coordinated in favour of cars, but the idea was to adjust them to make cycling easier and quicker. On most major arteries leading into the city centre, the traffic lights were coordinated to allow continuous flow of traffic, allowing cyclists to flow into the city in the morning rush hour. The lights reverse in the afternoon to send people home on a simple, tech-based tailwind. The principle was simple, at a speed of 20 km/h, cyclists during rush hour can surf a wave of green lights through the city without putting a foot down.
This "green wave" consists of LED lights in the asphalt or on posts that tell the cyclist whether he or she can cross the next traffic light at the speed he or she has selected when the lights are green. Countdown signals are also used. If a cyclist remains in the green wave, she/he is given the green light at the next intersection - and at the next - and the next - and so on. The system is connected to the surrounding intersections and traffic signals to ensure perfect coordination with other road users and to generate an ideal traffic flow.
The green waves for cyclists was established along three streets: Nørrebrogade, Østerbrogade and Farimagsgade. A string of green lights embedded in the bike path, the Green Wave, flashes on, helping cyclists avoid red traffic lights. It was decided on, and implemented by, the city's Department of Traffic. This was Green Wave V1.0. Green Wave 2.0 can identify bicycle users approaching an intersection and if there are five or more citizens roughly cycling together, the light will stay green up ahead until they pass.
The introduction of the green wave for cyclists resulted in an increased average speed from 15.1 to 20.7 km/h. This means a reduction of travel time by 2.5 minutes (nearly 30%) on just 2.2 km journey. Reduction or elimination of waiting times at crossings also saves space on the highway.
In order to prevent high risk of accidents with right-turning cars, Denmark is also investing in warning signs that draw the attention of drivers to cyclists. LEDs in asphalt or LED variable message signs warn motorists, for example, when bicycles cross the bike lane, as these are often difficult to see in the side mirror - the keyword is "blind spot". When a cyclist is detected, the signs light up with a speed reduction message or a warning message. If there are no more cyclists in the danger area, they switch off automatically.
Why it worked to 'fast track' the innovation/measure: Increasing cycling infrastructure, such as cyclometer infrastructure to inform cyclists about speed, temperature, time, passing bikes on that day/year, public announcements, train/bus times, events, etc., or green wave technology, assists cyclists and makes cycling more attractive. By installing the device, a city can motivate cyclists, thank them for their contribution to the environment or show statistics. At the same time, the traffic officers responsible can get a detailed picture of bicycle traffic - as is already common practice in many cities today for cars.
Lessons learnt: Transport by bus was initially adversely affected. Evaluations of Green Wave V1.0 showed that it had an unfortunate side-effect, increasing travel time for buses by up to 14 percent. Adaptive systems are now being used which prioritise between bikes and buses using data from traffic sensors and GPS in buses dynamically, in such a way that the buses are not delayed.
Sources or links:
Area: complex urban areas
Date implemented: Stage 1 in 2017 (ex-ante cost-benefit analysis); STage 2 in May 2021 (ex-post cost-benefit analysis
How long from concept to implementation: Stage 1: six months; Stage 2: fourteen months
Relation between efforts undertaken and benefits achieved: win-win
What was done and how: The C-MobILE project implemented so-called C-ITS services in eight cities. The main work for the cost-benefit analyses (CBAs) relied on the collection and processing of data to calculate the costs and benefits of the C-ITS services. For the purposes of the ex-ante CBA, and since no real-life data were available, a literature review was performed, including a significant number of projects and initiatives (at the European and US-level) launched prior to C-MobILE. These data (related both to costs and benefits of C-ITS) were processed and adapted appropriately for the C-MobILE purposes. Then, a methodology was defined for economic analysis and results calculation. For the ex-post CBA, no literature review was necessary, as data from the project could be used. Once the large-scale deployment of the C-ITS services in the eight cities were finalised, the cities provided their actual costs and logs collected from the end-user devices were used for benefits calculation.
Why it worked to 'fast track' the innovation/measure: This work contributes to acceleration as it highlights the importance of estimating the socio-economic aspect of a project/ deployment. Moreover, it serves as a guideline for executing CBA for ITS and C-ITS projects.
Lessons learnt: Thorough investigation and review of data to be used should be conducted in case there are no real-life data available. Furthermore, the methodology for economic analysis should be defined and adapted according to the specific characteristics of project deployment.
Tips for replication: The case study could be replicated in any other project/deployment related to ITS or C-ITS, considering any special characteristics of the project/deployment and proceeding with the necessary modifications.
Sources or links:
Area: urban
Date implemented: Some of the elements, such as the Green Waves and CyKap systems, were deployed relatively rapidly throughout 2013 to 2015. Others, such as the traffic management system (2013–2018) and the COMPASS model (2016–2022) took longer to conceive, develop and deploy. All systems are fully or partially operational today
How long from concept to implementation: Budgetary processes are slow, as are the development of EU funding proposals, so the initial concept was developed more than a year before the projects could start, followed by market investigation, project pathfinding, partner clarification, and specification phases, which can easily take a year. Then the deployment can take one to two additional years.
Relation between efforts undertaken and benefits achieved: Projects are undertaken based on promised or expected benefits with respect to improved services and conditions for road users and citizens in Copenhagen. A project might not always achieve this goal directly or, worst case, might fail in its purpose, while still providing benefits such as increased knowledge and insight into the feasibility of a solution or technology. The calculation of the relationship between effort and benefits is therefore always hard in innovation and development projects. But it is important for all private actors and public authorities to undertake these projects regardless, as there is always learning and insight and mostly real experienced benefits for the road users and citizens.
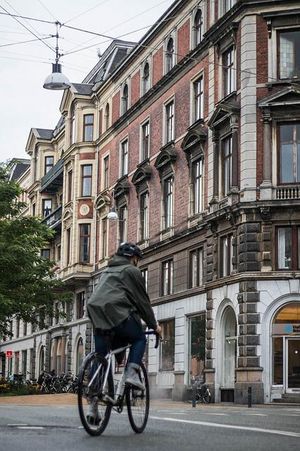
What was done and how: The first stage was to encourage the market in creating and offering standard traffic management, ITS and C-ITS solutions for cyclists. Secondly, when the market did not have adequate solutions ready, the City of Copenhagen attempted to create custom and innovative solutions for the needs in the city.
Why it worked to 'fast track' the innovation/measure: Cycling is the transport mode of the future, and it is important to encourage the market to see this. Cities like Copenhagen are firstly ensuring they are accomodating this, and later implementing ready solutions, alongside other cities with similar ambitions, to increase the adoption of solutions with improved conditions for their cyclists, road users and citizens as a result.
Lessons learnt: Sometimes the technologies are mature, but the suppliers providing them are less so. The market is still to some degree dominated by an outdated logic that competitions and not cooperation is the way to secure the most profits. Some are still focused on their piece of the cake, instead of contributing to the whole cake.
Tips for replication: Use real open standards and open source systems. Off the shelf hardware is preferable. Make sure ownership of the system is yours to the largest degree possible. Be very aware of vendor lock in and black boxed systems.
Area: urban
Date implemented: June 2017 to January 2018
How long from concept to implementation: It took only 6 months to initiate talks with Brussels and other partners, to ensure the technology and app were fit-for-purpose, to recruit cyclists, and to launch the pilot project on the streets of the city.
Relation between efforts undertaken and benefits achieved: Very good! The PING tool was successfully tested by cyclists, used by Brussels to support its cycling policies and, one year later, replicated in other cities.
What was done and how: To support and improve cycling policy in the Brussels Capital Region of Belgium, a participatory pilot project was launched in 2017 referred to as "PING If you care!"
This pilot project centered around an innovative tool called PING, which allows cities to finetune their cycling policies with the help of citizen science. In other words: by engaging cyclists themselves. Developed by Mobiel 21 and Bike Citizens, PING was used in Brussels to specifically collect data about cycling routes and bottlenecks in the city.
The innovative tool consists of two main elements: a PING button and the Bike Citizens app. The PING button is a small push button that a cyclist can conveniently attach to their bike’s handlebar, or to their clothing, and which is connected via Bluetooth to the Bike Citizens app on the cyclists' smartphone. When participating cyclists encountered an unsafe situation during a ride, they would simply press (or "ping") the button, which automatically marked the location in the app. When their bike journey finished, cyclists could add more information about the unsafe situation in the app, for example by adding a comment or a specific category. In total, almost a thousand cyclists joined the pilot project and recorded over 24,000 categorised pings!
Finally, the app gathered all of these pings on a detailed heatmap of cycling routes and bottlenecks, which Brussels then used to support and improve its cycling policies.
Why it worked to 'fast track' the innovation/measure: PING gave Brussels access to a vast amount of relevant and reliable data. Moreover, by adding analysis and policy recommendations to the raw data collected by cyclists, PING also directly supported cities like Brussels in reviewing or readjusting their cycling policies. This combination of data collection and data analysis is what helps accelerate the development of good cycling policies.
Lessons learnt: The pilot project in Brussels made clear that PING needs to: cooperate with a representative sample of cyclists; actively engage both stakeholders and cyclists throughout the duration of a campaign, which should be limited in time; and ensure that communication with stakeholders and cyclists continues even after the campaign has ended.
Tips for replication: After Brussels, PING campaigns were also launched in Amsterdam (2019) and Munich (2019). The campaign proved flexible, and adaptable to suit every city’s needs and wishes, both towards a specific neighbourhood or a specific target group (e.g. children in a school environment). Moreover, cities can use the tool not only to map cycling bottlenecks, but also to collect journey data (such as routes, speed and distance), to prioritise infrastructure investments, and to evaluate policy changes.
Sources or links:
- PING website: https://pingifyoucare.eu/
- PING leaflet (in English): https://www.mobiel21.be/assets/documents/PING-Leaflet-EN.pdf

Area: urban
Date implemented: 2019
How long from concept to implementation: 4 months
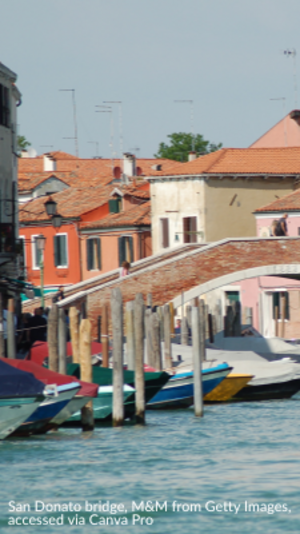
Relation between efforts undertaken and benefits achieved: Very good. The Bikenomics study fostered a new discussion in San Donato Milanese about cycling investment opportunities. Since the publication of the analysis, the town approved a new bike plan, completed 3 km of municipal cycling lanes and an important cycling connection to a nearby town, and organised four local cycling-related events, including a bike-to-school initiative. For these efforts, San Donato has been recognised as a “bike-friendly” city by the national Italian cycling association (FIAB).
What was done and how: Bikenomics, or the application of economic thinking to cycling, was used by Decisio to assess the potential value and impact of the Bike Plan of San Donato Milanese, an industrial town just outside Milan, which seeks to increase the currentcycling modal share from 3-5% to 15% by 2030. Specifically, Decisio used a cost-benefit analysis to compare two different scenarios: a “business-as-usual” scenario, in which cycling is not actively promoted, and an “intervention” scenario, in which policy-makers act according to the bike plan and reach the 15% target.
Using forecasts, the first scenario assumed mobility would increase according to population and GDP, and modal shares would change very little. In the “intervention” scenario, Decision kept the total amount of forecasted trips, but varied the modal share according to the targets of the Bike Plan. Both scenarios were then assessed in terms of congestion, work productivity, healthcare costs, greenhouse gas emissions, and so on.
Decisio’s analysis of these two scenarios showed the town’s policy-makers that the “business-as-usual” scenario would translate into a 5.5 million EUR social cost over a period of 10 years, whereas the “intervention” scenario would bring about almost 16 million EUR in societal benefits by 2030, mostly associated with increased physical activity. Even when factoring in the costs of implementing the bike plan (2.5 million EUR + 1% maintenance cost per year), the benefits of intervening outweighed its costs by a factor of 7. Notably, the analysis indicated the positive difference between “doing nothing” and intervening becomes even more pronounced beyond the 10-year timeframe.
Why it worked to 'fast track' the innovation/measure: Using data, Bikenomics can show that “doing nothing” in terms of active mobility is not free. Quite the opposite: it is extremely costly for society. When policy-makers have access to this hard evidence, expressed in monetary terms, they are more inclined to approve and carry through investments in cycling and other forms of active mobility.
Lessons learnt: Using Bikenomics, and focusing on cycling's socio-economic benefits, can put cycling on the agenda of policy-makers even in cities or countries where it is not as popular and widespread. The cost-benefit analysis proved an effective communication tool to explain the impacts and benefits of active mobility paradigms to the town’s stakeholders. Bikenomics is helpful especially in car-centric contexts, mainly to explain that any cycling investment is also (and, in some cases, particularly) going to benefit those who do not cycle. In short, it shows that promoting cycling benefits everyone.
Tips for replication: A Bikenomics analysis is straight-forward to replicate in most contexts, provided some expertise is available either within the public administration or externally. Possibly, the key combination in San Donato was the grouping of writing the bike plan, analysing its socio-economic benefits, and involving the local stakeholders and the population at the same time and within a “fast” process to keep the momentum going.
Sources or links:
Area: urban
Date implemented: 2022
How long from concept to implementation: 6 months
Relation between efforts undertaken and benefits achieved: fine; there were additional unforeseen efforts needed to get in touch with telecom companies
What was done and how: In essence, this was an innovative partnership and scoping exercise. In order to develop and deploy innovative data collection methods, the municipality had meetings with a variety of telecom companies to understand what was possible. Surveys and comparisons were gathered. This task also included webinars and capacity development strategies that shaped the state-of-the-art in terms of knowledge.
Why it worked to 'fast track' the innovation/measure: Although this scoping exercise took longer than planned due to troubles contacting telecom companies, the measure was still completed quickly.
Lessons learnt: The municipality learnt they there was a need to find and propose their own location as a public authority in the data market environment; success depends on the current "location" of the public authority. They also needed to upgrade their competences on big data management and offers.

Area: urban
Date implemented: 2019
How long from concept to implementation: 1 year
Relation between efforts undertaken and benefits achieved: good
What was done and how: This is related to the deployment of the LTZ. Cars were restricted in the city centre, including for residents. However, residents were given mobility vouchers to compensate for this. It was hoped that residents would not keep or use their cars (they were restricted in use, but not banned), but rather use the mobility vouchers for public transport that they had been provided with.
Following this, the LTZ was further expanded, and in 2019, the LTZ became an environmental-LTZ, where residents also had further restrictions. These were related to EURO levels; if residents had a EURO 5 new car, they could get a permit. If they didn’t want the permit, they could receive mobility vouchers instead.
This original initiative will remain in effect until 2025.
There are plans for the LTZ to be expanded again in 2-3 years, to cover the whole urban area. This will be called “The Green Area”.
Why it worked to 'fast track' the innovation/measure: The measure was introduced in stages.
Area: urban
How long from concept to implementation: 1 year
Relation between efforts undertaken and benefits achieved: good
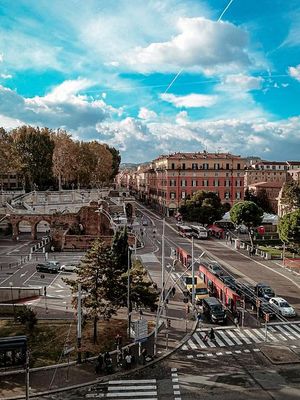
What was done and how: A new system was put in place that automatically controls vehicles accessing the pedestrian zone for delivery in accordance with the permits issued. This control is performed using cameras, automatic barriers, and automated tags.
Why it worked to 'fast track' the innovation/measure: Combining permit information with automatic barriers streamlines the process of access allowance.
Area: urban
How long from concept to implementation: 2 years
Relation between efforts undertaken and benefits achieved: moderate
What was done and how: The innovative measure was the launch of a fully integrated app. PID Lítačka is a mobile app integrating all the functions that any citizen or visitor may need to use during their city travel. It includes ticket purchases, search functions for travel connections, maps of the lines, and information about the fares. The app can be used for all public transport – metro, trams, buses and trains – in Prague and throughout the whole Central Bohemian Region. It can also be used to send paid-for tickets to others, and to activate multiple tickets simultaneously. Furthermore, you can currently get access to 20 minutes of carsharing free through the app.
Why it worked to 'fast track' the innovation/measure: Since the public transport network was already under one umbrella, it was not difficult to join the modes together into a single app.

Area: urban
Date implemented: Work on a strategy for the ‘Stadsfietsroute’, or Urban Cycle Route, kicked off in August 2019. By early 2020, a series of key stakeholder events were carried out to collect input from a wide range of actors including European experts, local authorities, cycling advocacy groups, as well as local residents. In October 2020, the city approved a vision and roadmap for the Urban Cycle Route.
How long from concept to implementation: The 2020 roadmap identified no less than 75 action points to put the Urban Cycle Route into practice. Some of these actions points were quick wins, which were realised in 2020-2021 (e.g. introducing cycling streets). Others are strategic projects that require a longer implementation process. For the redesign Bruges’ train station area, for example, the city conducted a survey in 2019-2022. Now, a final concept has been approved and the area will be redesigned by 2026.
Relation between efforts undertaken and benefits achieved: The Urban Cycle Route vision did not only put forward a new cycling network (‘where?’), but also a new mindset regarding future-proof cycling networks (‘how?’ and ‘what?’). Building on the motto ‘less speed, more city’, Bruges set course to a more intuitive and comfortable cycling network that respects the city’s rich historical and natural characteristics. In short, the efforts undertaken will bring benefits for years to come.
What was done and how: After identifying the need to improve cycling safety around the historical city centre, the city of Bruges commissioned a project team to develop a ring road corridor strategy in line with Flemish cycle highway standards. This team consisted of landscape architecture firm West 8 (NL), traffic engineers Vectris (BE), and a cycling consultancy firm Copenhagenize Design Co. (DK). This team soon questioned the ring road corridor approach, arguing that greater focus should be placed on the overall connectivity and integration of the city-wide cycling network. Thus, the project’s focus shifted from the ring road (FR30) to a more holistic ‘Stadsfietsroute’, or Urban Cycle Route. By integrating on-street and green corridors, the proposed Urban Cycle Route allows Bruges to exploit new opportunities in opening up the city for cyclists as well as to connect previously disconnected spaces through bicycle- and pedestrian-friendly infrastructure. The result will be a win-win situation for cyclists and the city at large.
Why it worked to 'fast track' the innovation/measure: Participation in the CIVITAS Handshake project, featuring an exploratory survey and multiple immersive symposia, lifted the project to new heights. It turned the Urban Cycle Route into a true urban renewal project instead of merely a traffic project.
Lessons learnt:
- Cycling planning is not just traffic planning. Cycling energizes a city and completes city life. It impacts both flows (or traffic) and places.
- There is no use in trying to become the next Copenhagen/Amsterdam/… Cities should write their own story by analysing their DNA and tapping into their demographic, historical and natural features.
- Do not underestimate the power of storytelling: visualise the change you want to see (e.g. through Photoshop). Action speaks louder than words.
- Exchanges with national and international cycling experts proved beneficial.
- Make links with current and future urban renewal projects. Bolster strategic alliances to ensure a strong and integrated plan.
Tips for replication:
- Take time to get the project definition right.
- Be critical. Be aware of your own biases.
- Do not mix up means and objectives. Cycling lanes are just one way of creating a cycling city.
- Trust in the process, even if this entails a leap in the dark. The challenge and the objectives suffice as a solid compass, especially when surrounded by a transdisciplinary team.
Sources or links: https://www.brugge.be/brochure-stadsfietsroute-f30-english
Area: urban
Date implemented: 2020-2022
How long from concept to implementation: The development of the concept and the design of the dropzone itself took about 6 months. The implementation is still ongoing.
Relation between efforts undertaken and benefits achieved: It is a relatively low effort and low cost measurement with potentially large benefits, especially in crowded areas. The benefits will increase even further when the dropzones are combined with No Park Zones (geofencing).
What was done and how: Dropzones for every type of shared mobility vehicle (kick scooter, moped, cargo bike and normal bike) were developed and deployed in order to solve the growing problem of obstructively parked shared vehicles.
Why it worked to 'fast track' the innovation/measure: It worked because one could focus on the 'problem areas' first for the deployment of the dropzones, which were mainly very crowdy places. In that way the exposure to the new measurement was very high, both for the users (who will use the dropzones) as for the inhabitants and visitors (who were complaining about it).
Lessons learnt: Dropzones work quite well in places where the space on the public domain is very limited. In other areas it will probably only work in combination with No Park Zones.
Tips for replication: Try to involve the shared mobility providers as much as possible. They can and will help with finding the right locations for the dropzones. They can also help with the promotion of the dropzones among their users through communication (news letters, adds, in app pop up messages, ...) and nudging campaigns (rewards for using the dropzones in a proper way). The realisation of No Park Zones (areas where it is prohibited to park unless inside of a dropzone and where this is made impossible through the software of the providers) will help in areas where the nuisance is very high.
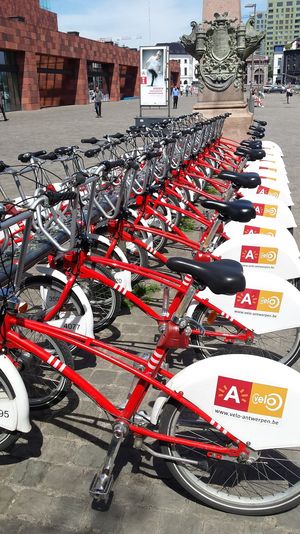
Subscribe to our Newsletter
Partners
This website is produced as part of the CIVITAS FastTrack Coordination and Support Action funded by the European Union Horizon 2020 research and innovation programme under grant agreement No 101006853. The sole responsibility for the content of this website lies with the FastTrack project and in no way reflects the views of the European Union.
